Open Access
Figure 2
Download original image
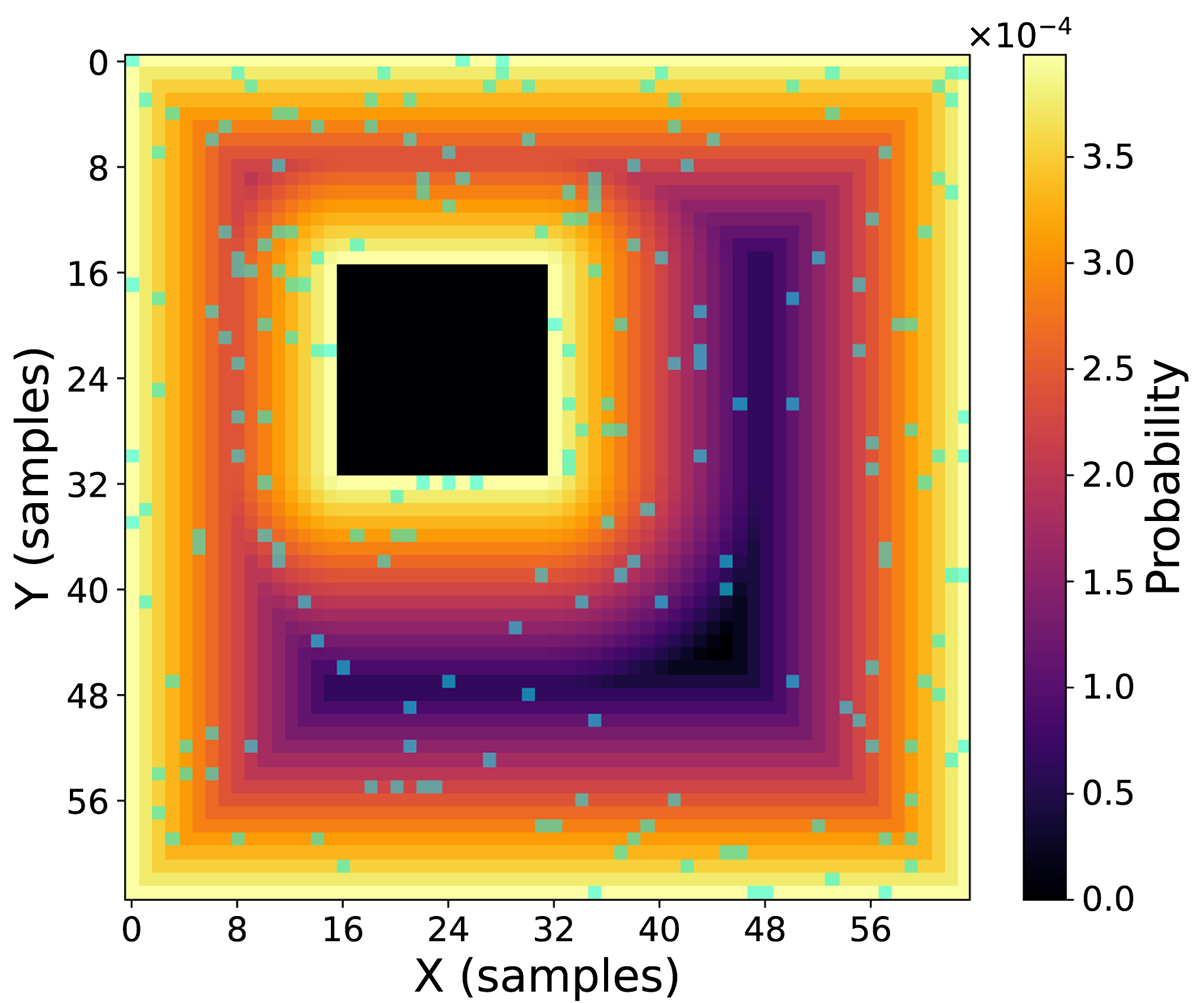
Probability density example for sampling excitation coordinates. 200 coordinates, highlighted in green, are sampled from a B+S domain which contains a 16 × 16 reflective object. Lighter areas have a higher probability of sampling.
Current usage metrics show cumulative count of Article Views (full-text article views including HTML views, PDF and ePub downloads, according to the available data) and Abstracts Views on Vision4Press platform.
Data correspond to usage on the plateform after 2015. The current usage metrics is available 48-96 hours after online publication and is updated daily on week days.
Initial download of the metrics may take a while.