Open Access
Figure 1
Download original image
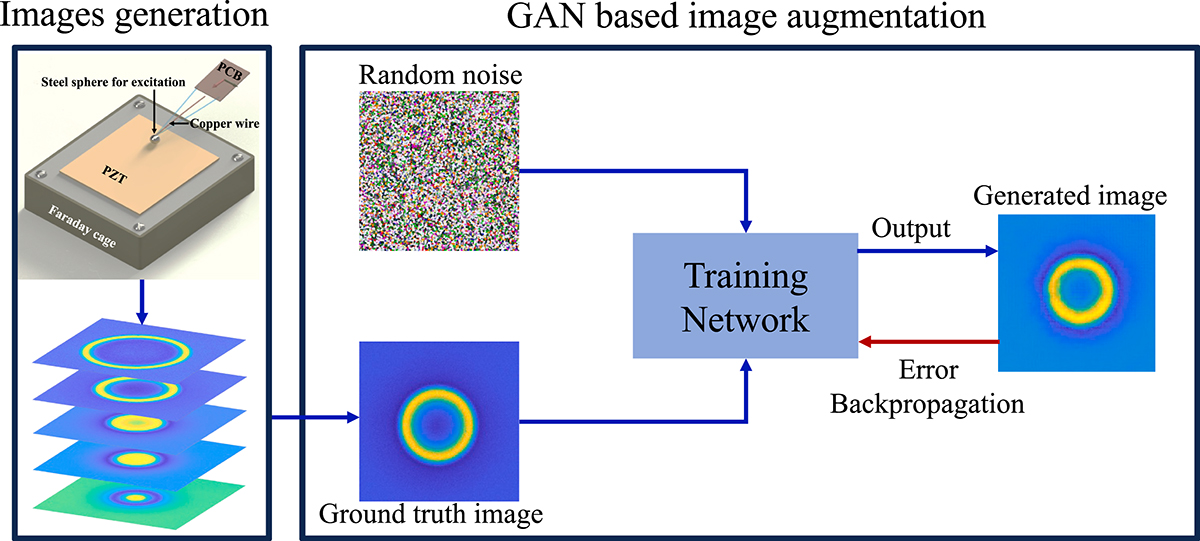
This figure depicts the overall strategy used in this paper. First, real data (ground truth) is acquired. This is followed by GAN-based data augmentation. Real images and random noise input images are fed into the network used to train. The network output is further used as error back-propagation to train the network.
Current usage metrics show cumulative count of Article Views (full-text article views including HTML views, PDF and ePub downloads, according to the available data) and Abstracts Views on Vision4Press platform.
Data correspond to usage on the plateform after 2015. The current usage metrics is available 48-96 hours after online publication and is updated daily on week days.
Initial download of the metrics may take a while.