Figure 6
Download original image
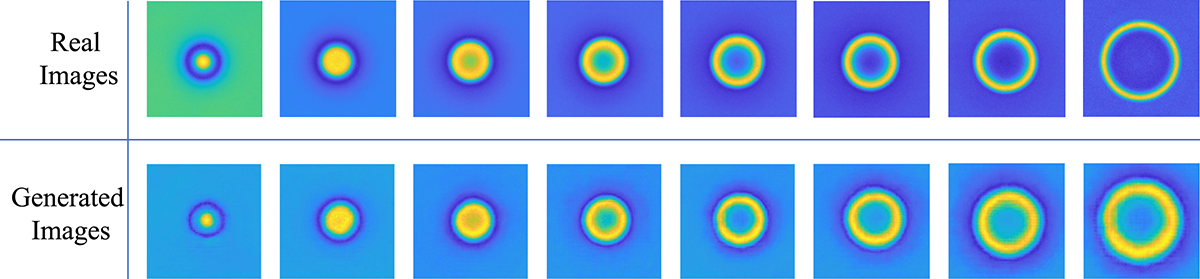
Images illustrating the visual quality of generated outputs at different training epochs. These images demonstrate the progression and improvement in image quality as the training process evolves, showing high-quality and diverse images at optimal epochs (a, b, c, and e). Additionally, the figure (f) includes examples of overfitted images generated at later epochs, highlighting the decrease in quality and diversity due to overfitting.
Current usage metrics show cumulative count of Article Views (full-text article views including HTML views, PDF and ePub downloads, according to the available data) and Abstracts Views on Vision4Press platform.
Data correspond to usage on the plateform after 2015. The current usage metrics is available 48-96 hours after online publication and is updated daily on week days.
Initial download of the metrics may take a while.