Open Access
Figure 4.
Download original image
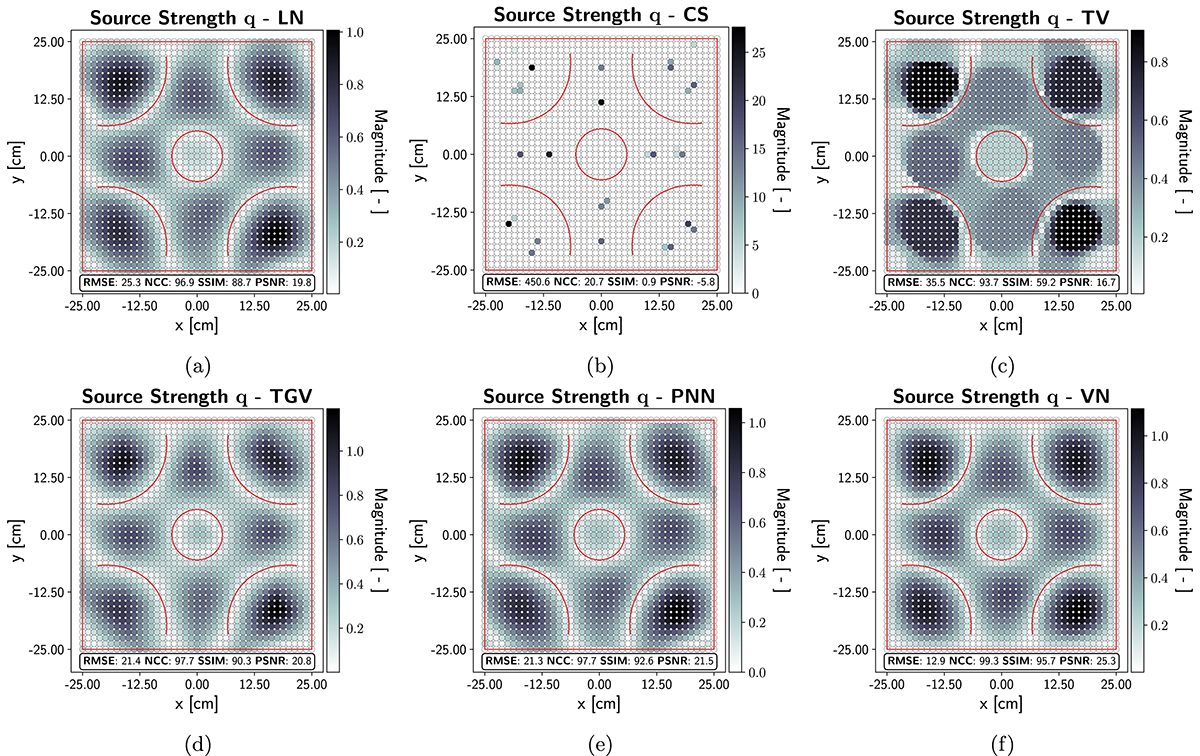
Equivalent source reconstructions of the center-driven plate in Figure 3a vibrating at f=800 Hz based on (a) LN, (b) CS, (c) TV, (d) TGV, (e) PNN, and (f) VN, retrieved from measurements with SNR=28 dB taken at a distance of zm=6 cm.
Current usage metrics show cumulative count of Article Views (full-text article views including HTML views, PDF and ePub downloads, according to the available data) and Abstracts Views on Vision4Press platform.
Data correspond to usage on the plateform after 2015. The current usage metrics is available 48-96 hours after online publication and is updated daily on week days.
Initial download of the metrics may take a while.