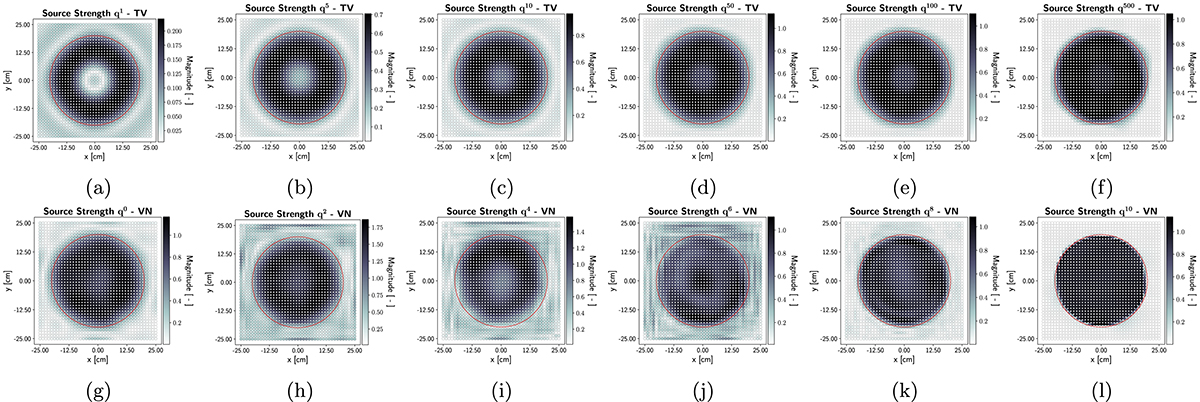
Figure 9.
Download original image
Intermediate equivalent source reconstructions qt of the baffled circular piston in Figure 3b vibrating at f=1 kHz. The top row (a–f) shows estimates provided by TV after (a) t=1, (b) t=5, (c) t=10, (d) t=50, (e) t=100, and (f) t=500 iterations. The bottom row (g–l) shows estimates provided by the even layers of the VN, where (g) is the initial approximation q0 according to equation (31), and (l) is the final network output q10.
Current usage metrics show cumulative count of Article Views (full-text article views including HTML views, PDF and ePub downloads, according to the available data) and Abstracts Views on Vision4Press platform.
Data correspond to usage on the plateform after 2015. The current usage metrics is available 48-96 hours after online publication and is updated daily on week days.
Initial download of the metrics may take a while.