Figure 6.
Download original image
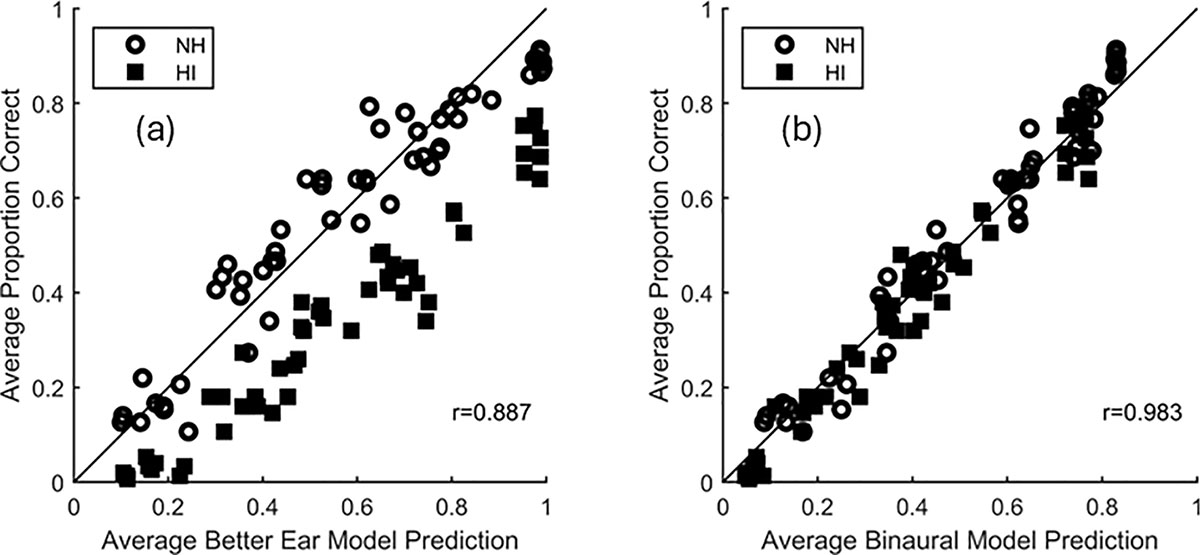
Scatterplots comparing (a) better-ear HASPI v2 predictions to the binaural subject intelligibility scores using an audiogram scale factor of 1, and (b) binaural HASPI predictions to the binaural subject intelligibility scores using an audiogram scale factor of 1.5. Each point represents the data for a single processing condition averaged over repetitions and either NH or HI subjects for that condition. Data for the NH subjects are plotted using open circles and data for the HI subjects are plotted using filled squares.
Current usage metrics show cumulative count of Article Views (full-text article views including HTML views, PDF and ePub downloads, according to the available data) and Abstracts Views on Vision4Press platform.
Data correspond to usage on the plateform after 2015. The current usage metrics is available 48-96 hours after online publication and is updated daily on week days.
Initial download of the metrics may take a while.