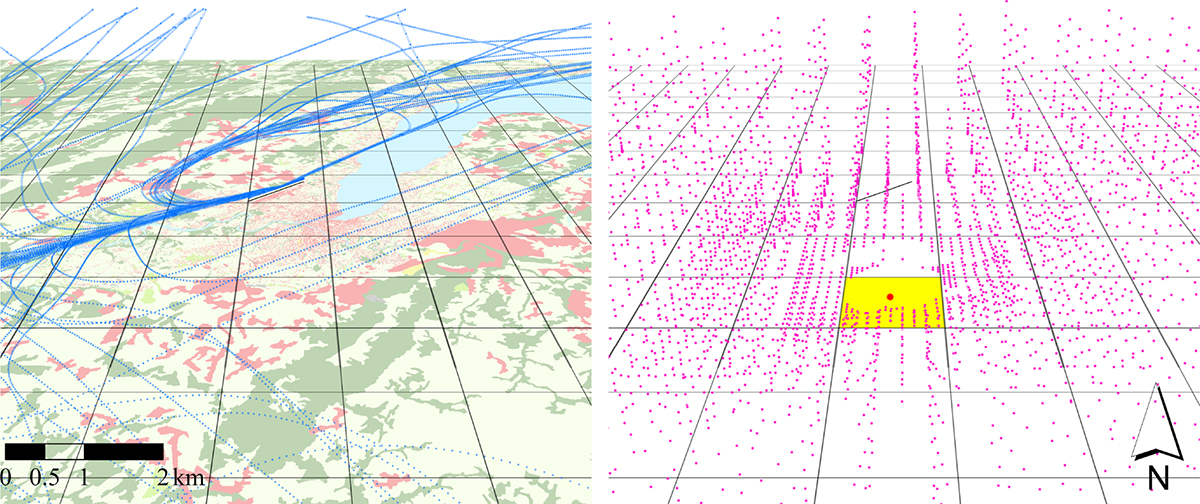
Figure 2.
Download original image
Ground cover data and computation tiles displayed after importing the flight trajectories (left). Receiver point of interest (red point) shown after the cell grid point generation (right). The cell grid points indicate virtual source positions. For each source-receiver combination a sound propagation calculation is performed and stored in a database.
Current usage metrics show cumulative count of Article Views (full-text article views including HTML views, PDF and ePub downloads, according to the available data) and Abstracts Views on Vision4Press platform.
Data correspond to usage on the plateform after 2015. The current usage metrics is available 48-96 hours after online publication and is updated daily on week days.
Initial download of the metrics may take a while.