Figure 6.
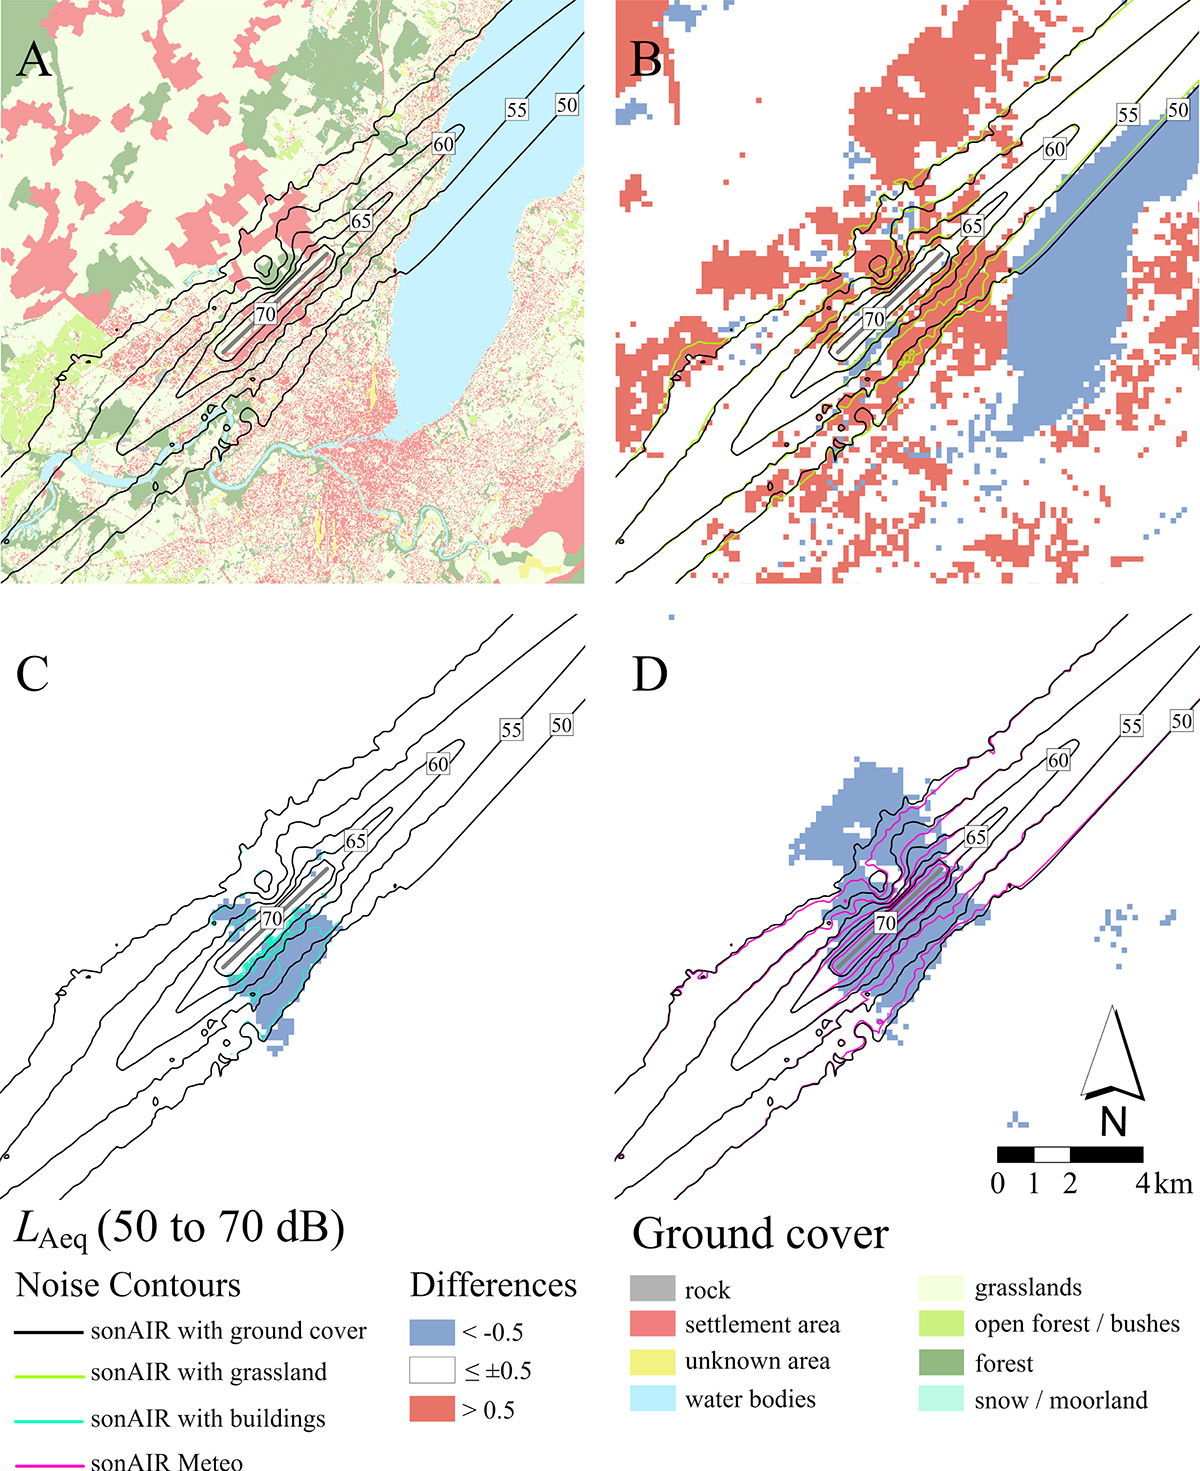
Download original image
Individual sonAIR versions for GVA2017 during 06–22 h time period: (A) sonAIR contours with detailed ground cover, (B) sonAIR contours with grassland, (C) sonAIR contours with detailed ground cover and buildings, (D) sonAIR contours with detailed ground cover and METEO. For (B)–(D), grid differences (new version minus baseline version A) and resulting contours for each version are shown.
Current usage metrics show cumulative count of Article Views (full-text article views including HTML views, PDF and ePub downloads, according to the available data) and Abstracts Views on Vision4Press platform.
Data correspond to usage on the plateform after 2015. The current usage metrics is available 48-96 hours after online publication and is updated daily on week days.
Initial download of the metrics may take a while.