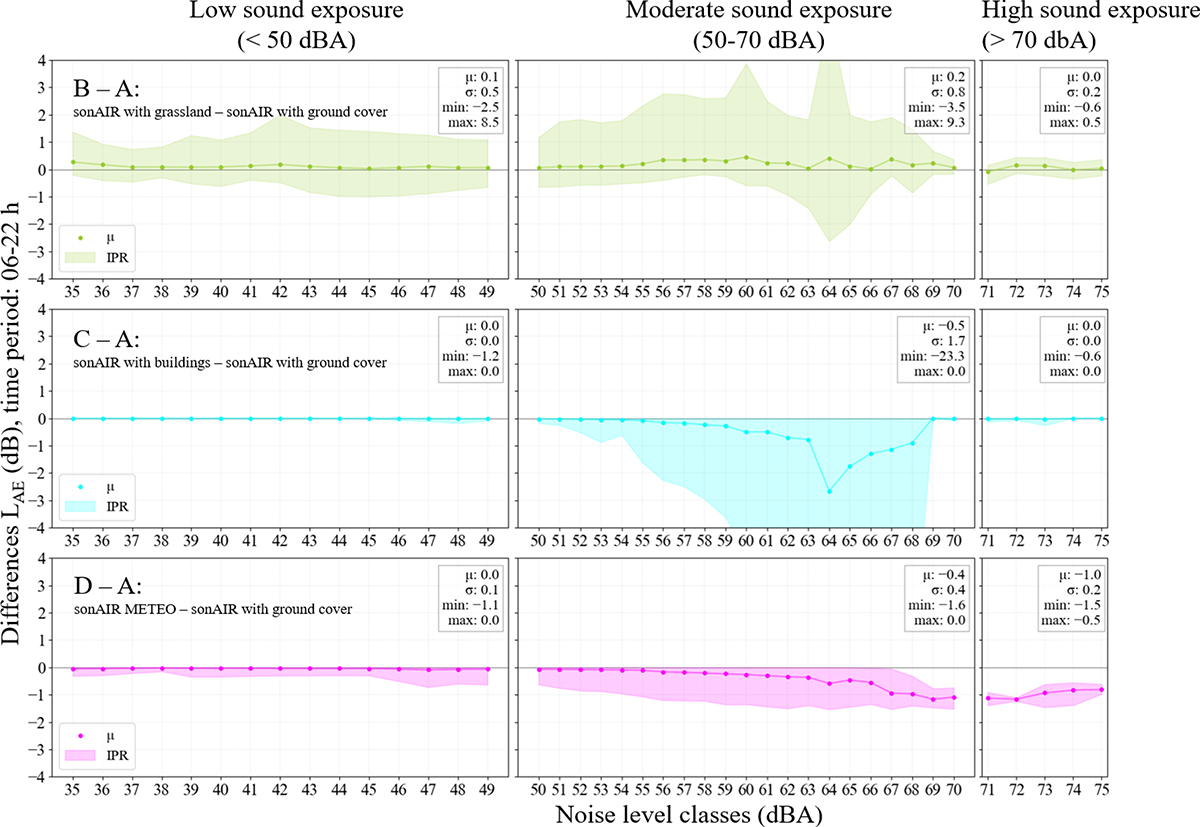
Figure 7.
Download original image
Statistical summary of differences for GVA2017 during 06–22 h time period, including mean and interpercentile range (IPR) – the range between the 2.5th and 97.5th percentiles, capturing 95% of the data –, as well as overall mean (μ), standard deviation (σ) and min/max values, across low, moderate, and high sound exposure levels.
Current usage metrics show cumulative count of Article Views (full-text article views including HTML views, PDF and ePub downloads, according to the available data) and Abstracts Views on Vision4Press platform.
Data correspond to usage on the plateform after 2015. The current usage metrics is available 48-96 hours after online publication and is updated daily on week days.
Initial download of the metrics may take a while.