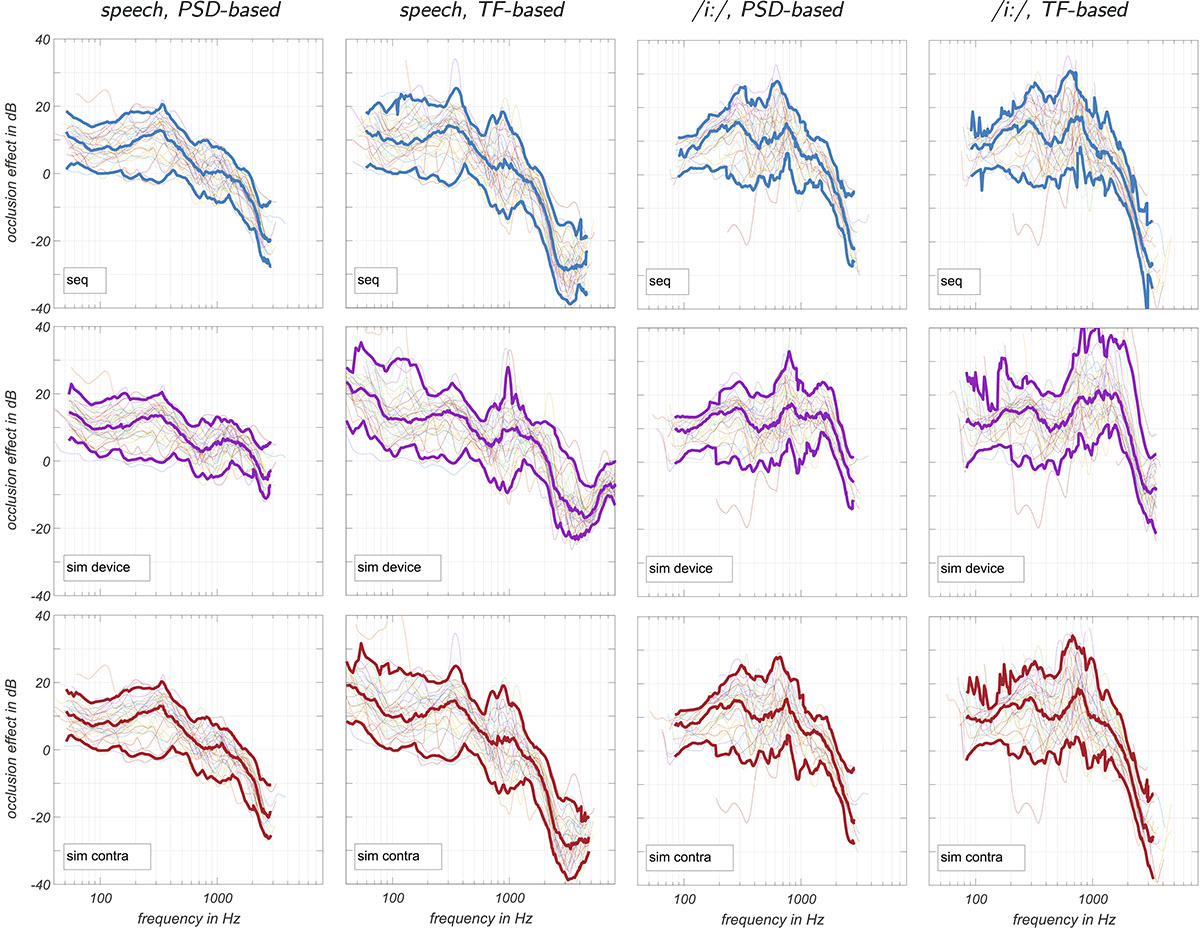
Figure 10.
Download original image
Measured occlusion effects in all 37 ears. Thin lines represent individual ears, thick lines 5- 50- and 95-percentiles of all level differences at frequencies where data from at least 10 ears were considered valid according to Section 2.6.3. Top: sequentially measured OEs (Eqs. (6), (9)), middle: simultaneously measured OEs using the device microphone as reference (Eq. (7) and first equation in Eq. (10)), bottom: simultaneously measured OEs using the probe tube microphone in the open contralateral ear as reference (Eq. (8) and second equation in Eq. (10)).
Current usage metrics show cumulative count of Article Views (full-text article views including HTML views, PDF and ePub downloads, according to the available data) and Abstracts Views on Vision4Press platform.
Data correspond to usage on the plateform after 2015. The current usage metrics is available 48-96 hours after online publication and is updated daily on week days.
Initial download of the metrics may take a while.