Open Access
Figure 8.
Download original image
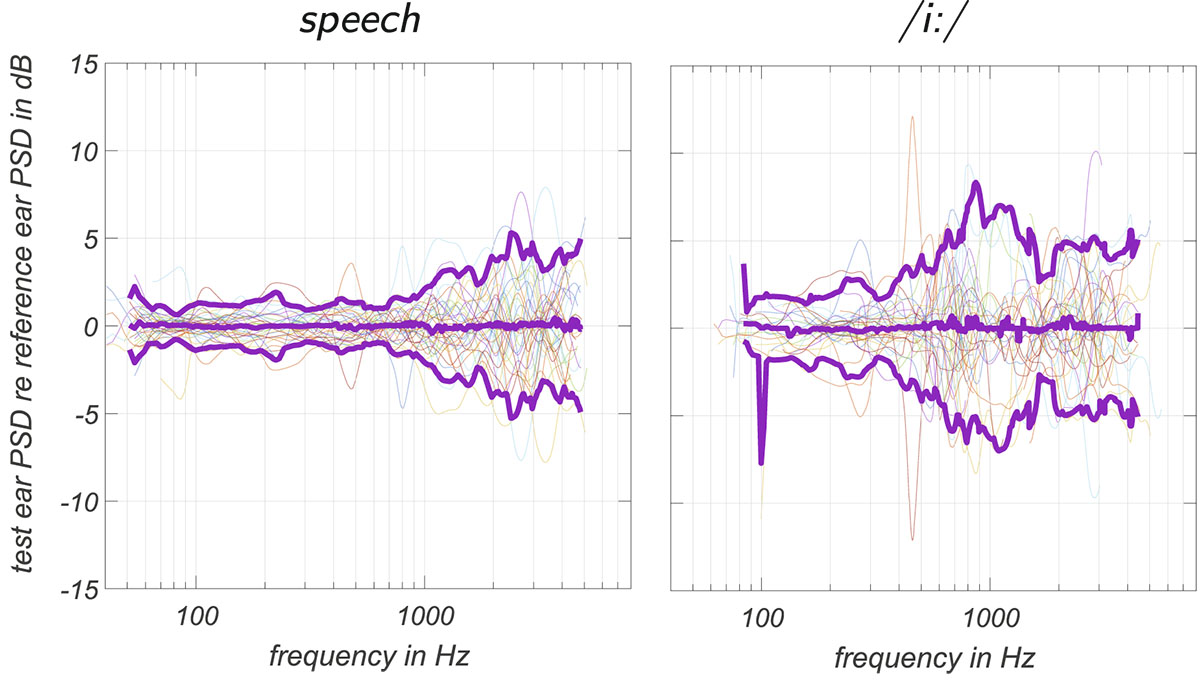
PSD level difference between test and reference ear in the open ear condition. Thin lines represent individual participants, thick lines 5- 50- and 95-percentiles of all level differences at frequencies where data from at least 10 participants were considered valid according to Section 2.6.3.
Current usage metrics show cumulative count of Article Views (full-text article views including HTML views, PDF and ePub downloads, according to the available data) and Abstracts Views on Vision4Press platform.
Data correspond to usage on the plateform after 2015. The current usage metrics is available 48-96 hours after online publication and is updated daily on week days.
Initial download of the metrics may take a while.