


Figure 12.
Download original image
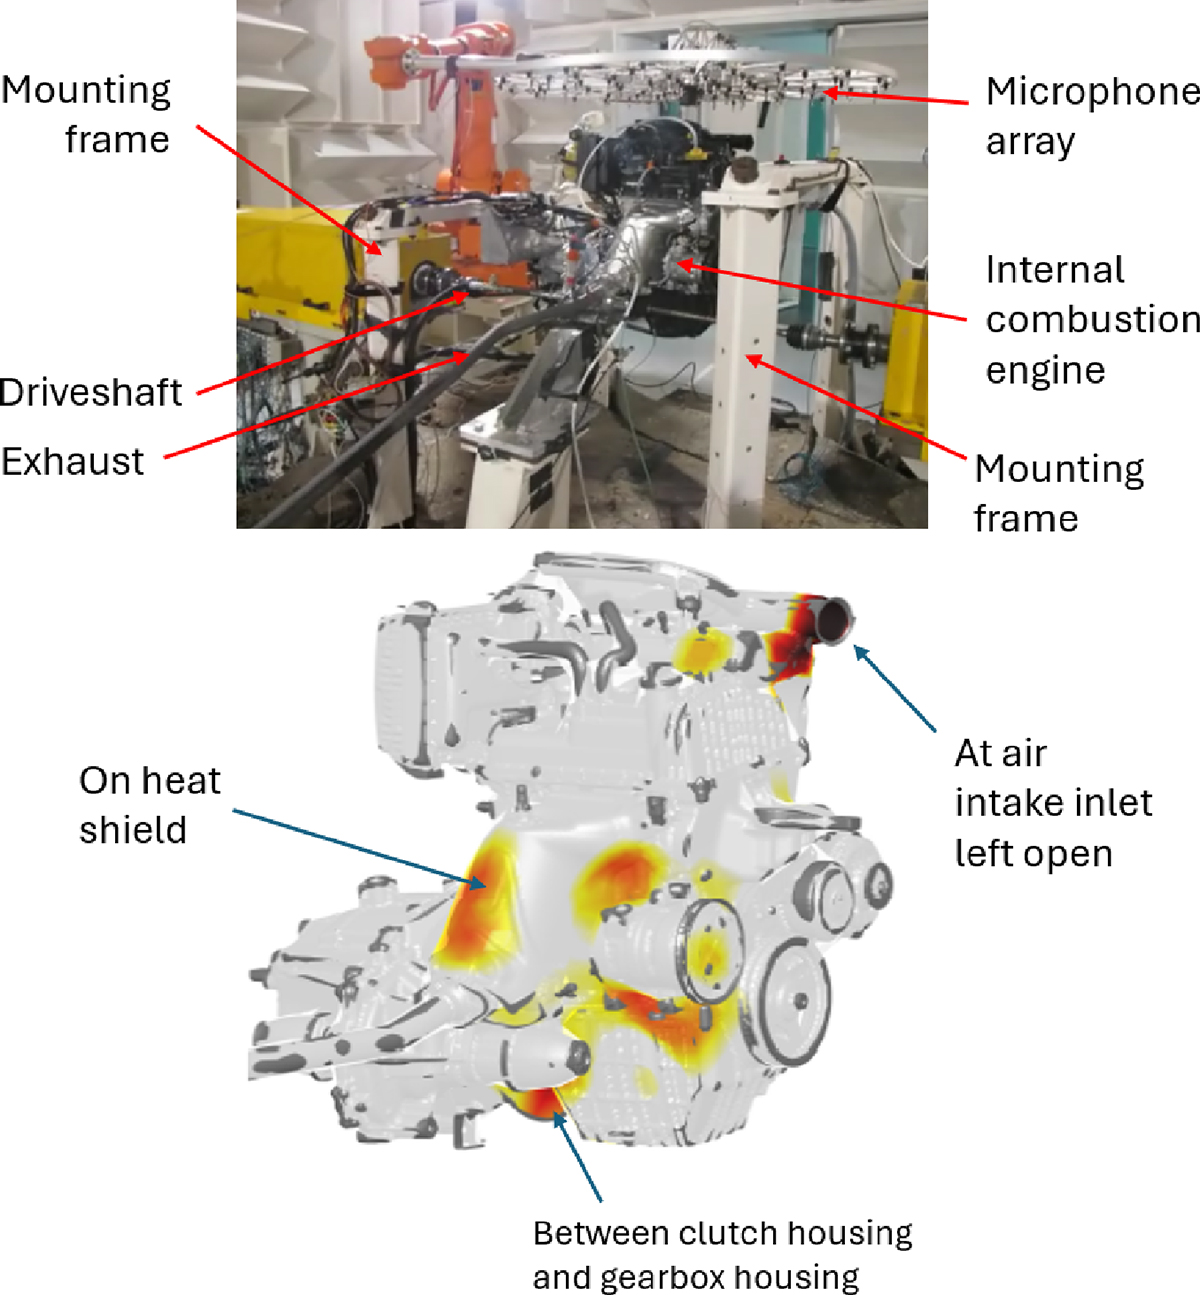
Example of intensity map reconstructed with iPTF on the skin surface of an internal combustion engine on a test bench at 3000 rpm, full load, using only pressure measurements. Top: experimental setup showing that mounting frames were not masked during measurements; Bottom: localisation of areas of high acoustic intensity [61].
Current usage metrics show cumulative count of Article Views (full-text article views including HTML views, PDF and ePub downloads, according to the available data) and Abstracts Views on Vision4Press platform.
Data correspond to usage on the plateform after 2015. The current usage metrics is available 48-96 hours after online publication and is updated daily on week days.
Initial download of the metrics may take a while.