Figure 12
Download original image
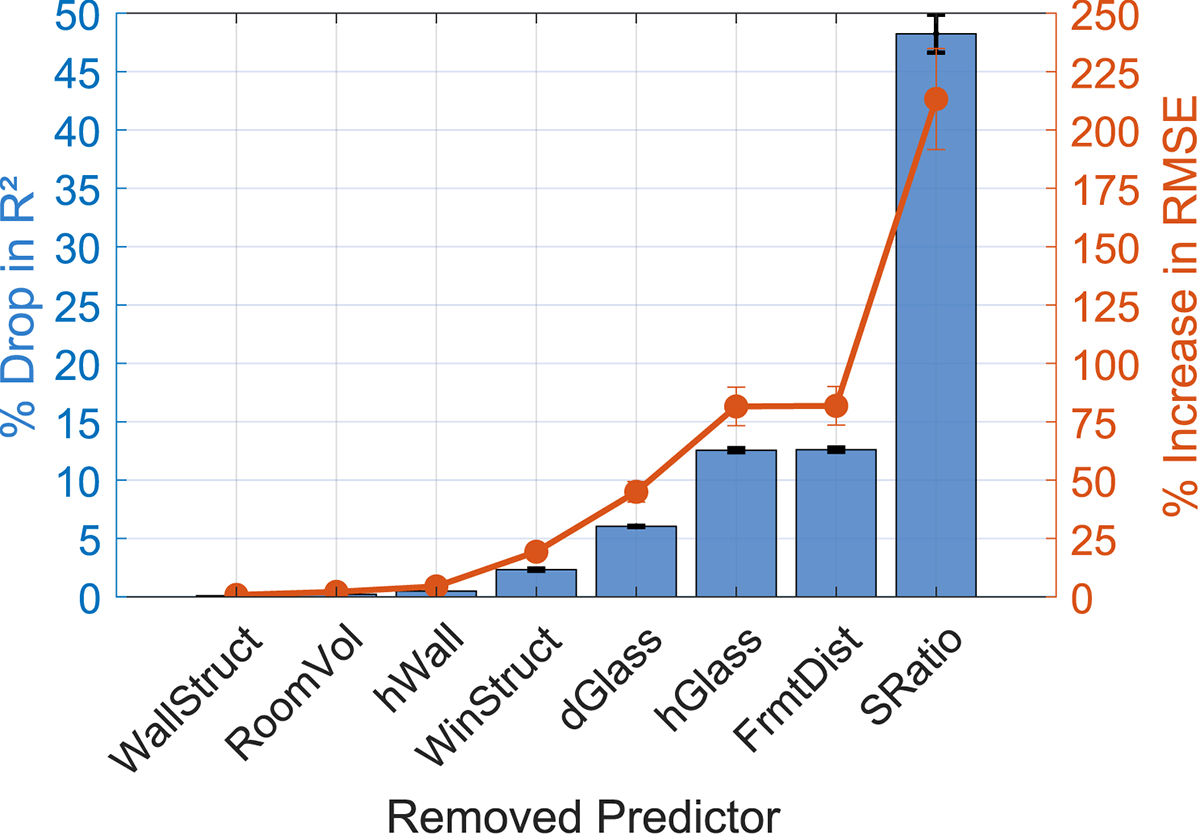
Percentage drop in R 2 (blue bars, left y-axis) and percentage increase in RMSE levels (orange line with markers, right y-axis) following the exclusion of individual predictors from the random forest model. Error bars represent standard deviations across the noise indicator models. Predictors are ordered by increasing impact on performance loss.
Current usage metrics show cumulative count of Article Views (full-text article views including HTML views, PDF and ePub downloads, according to the available data) and Abstracts Views on Vision4Press platform.
Data correspond to usage on the plateform after 2015. The current usage metrics is available 48-96 hours after online publication and is updated daily on week days.
Initial download of the metrics may take a while.