Figure 4
Download original image
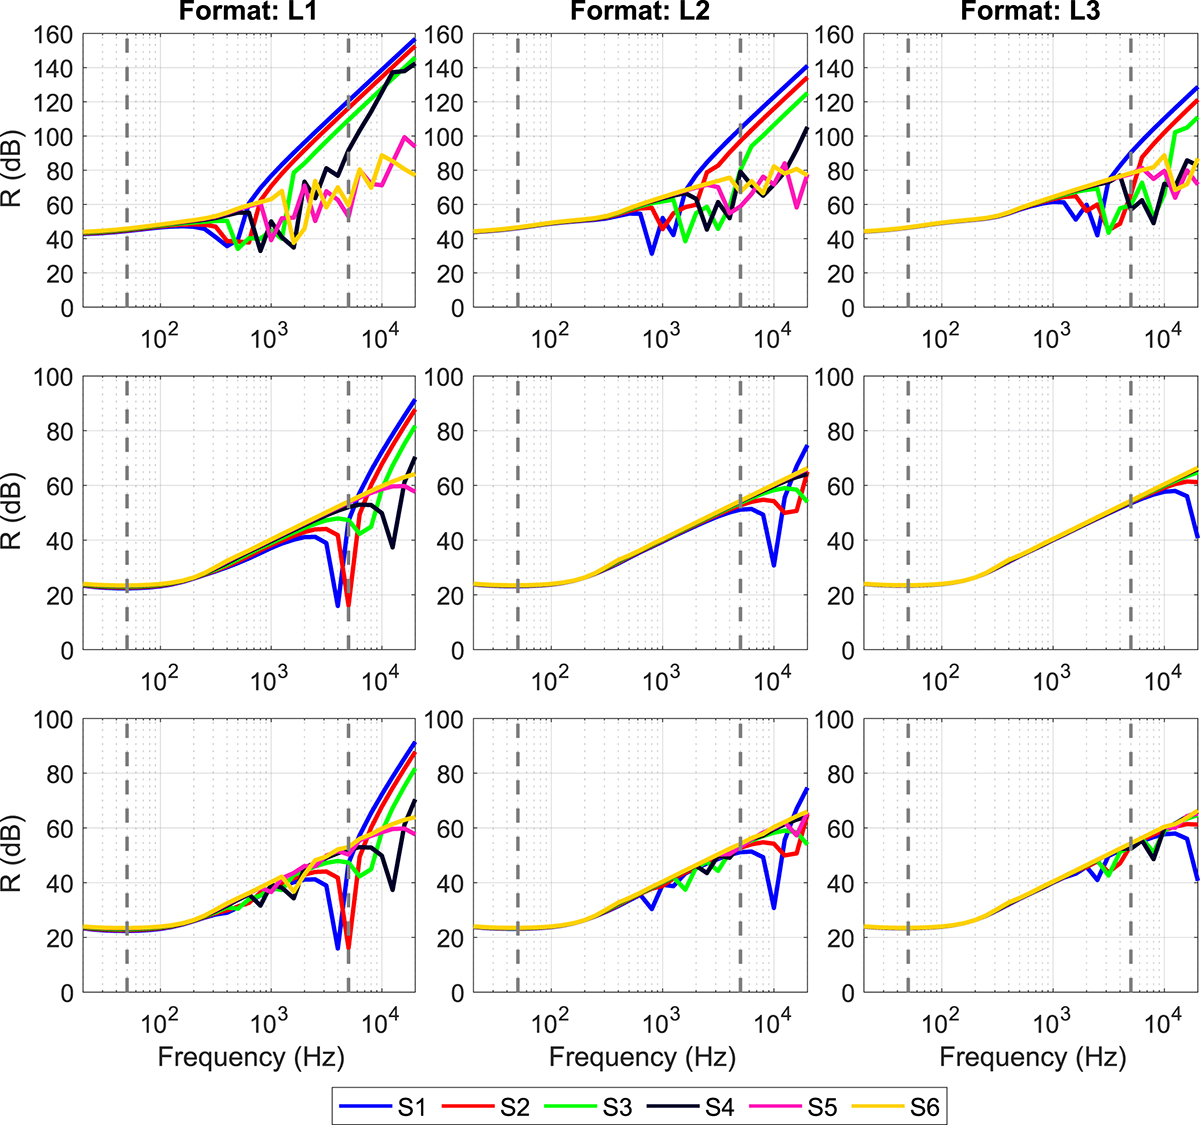
Sound insulation, expressed via the sound reduction index R, of (top) wall, (mid) glass, and (bottom) total surface for each sound source position S1–S6 and format L1–L3. Responses for sources S7–S11 are omitted due to their overlap with those of S1–S6. Gray dashed lines denote the typical building acoustics range (50 Hz–5 kHz).
Current usage metrics show cumulative count of Article Views (full-text article views including HTML views, PDF and ePub downloads, according to the available data) and Abstracts Views on Vision4Press platform.
Data correspond to usage on the plateform after 2015. The current usage metrics is available 48-96 hours after online publication and is updated daily on week days.
Initial download of the metrics may take a while.