Figure 6
Download original image
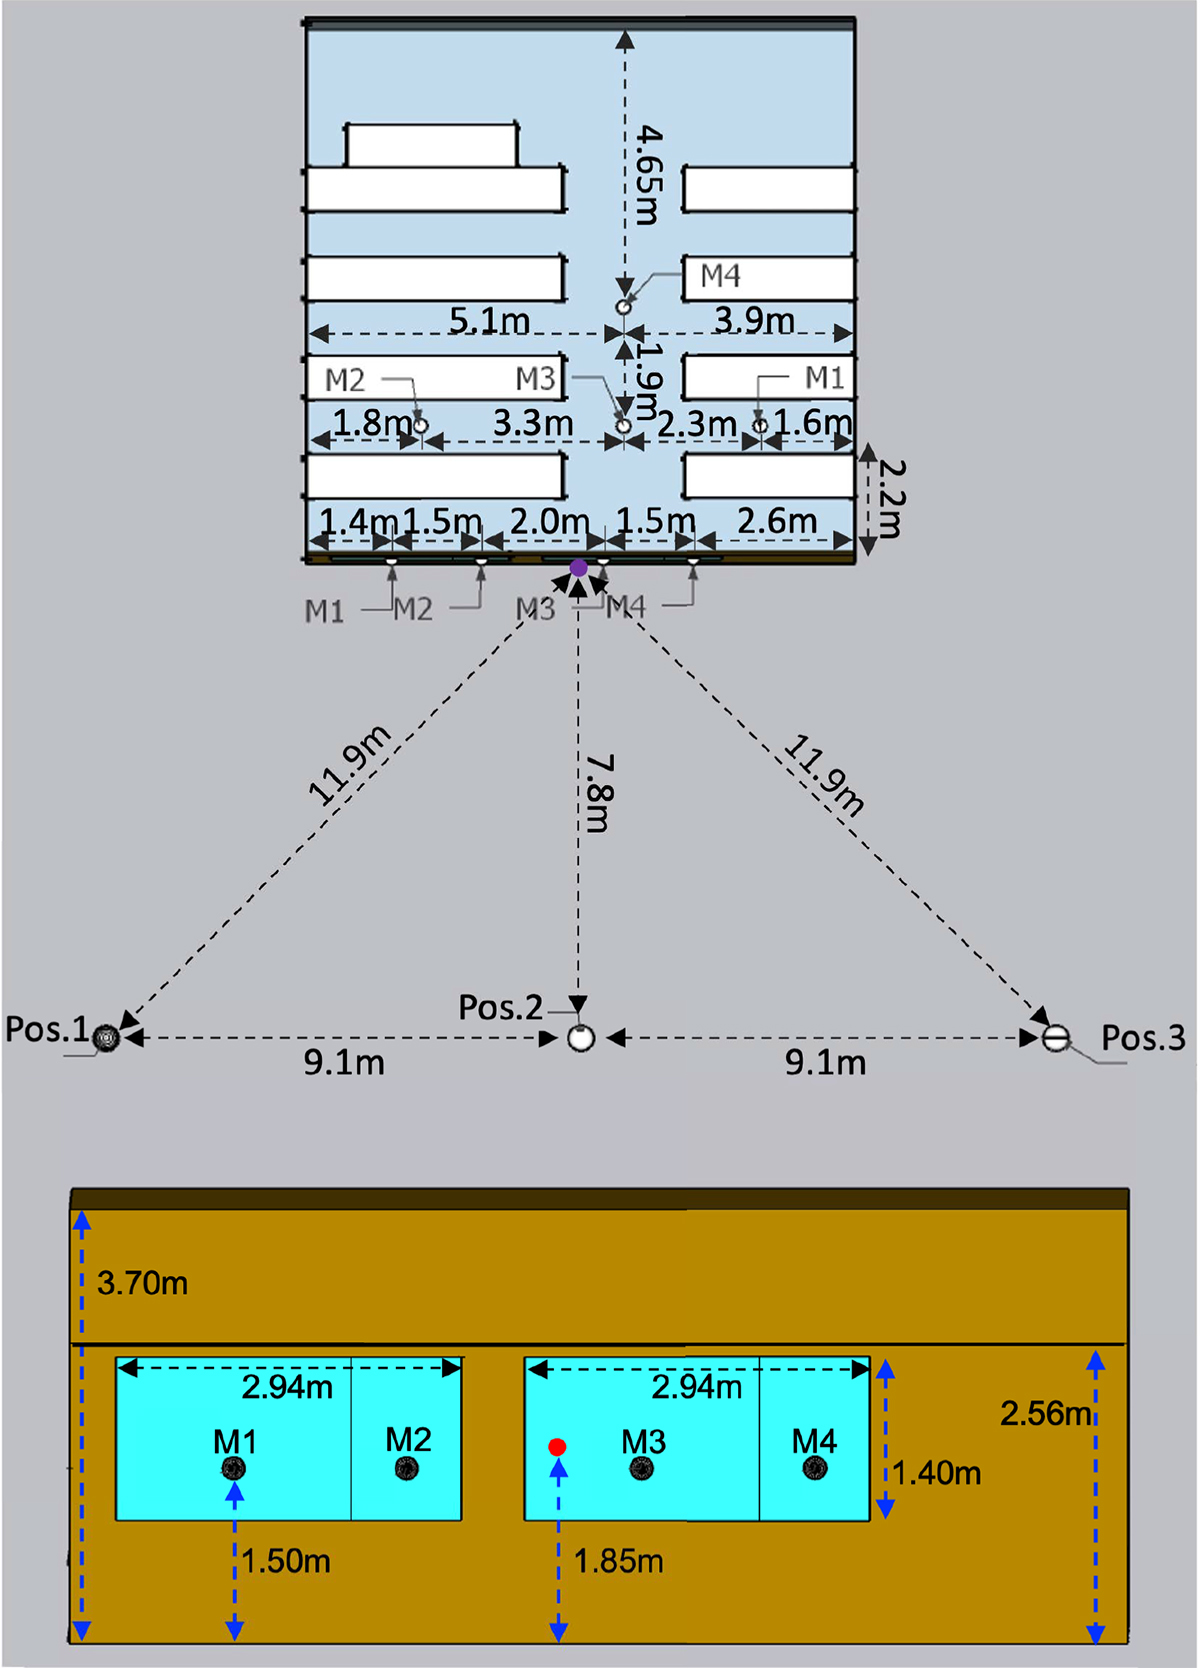
Schematic illustration of the experimental validation location and setup: (top) top-view of the indoor and outdoor environments, including the positions of sound sources (Pos.1–Pos.3) as well as of outdoor and indoor receivers (M1-M4), and (bottom) front-view of the building façade structure, including the positions of outdoor receivers. The centre of the façade in the top and front views is indicated by the purple and red markers, while the distances in the horizontal and vertical planes are denoted by the dashed black andblue lines.
Current usage metrics show cumulative count of Article Views (full-text article views including HTML views, PDF and ePub downloads, according to the available data) and Abstracts Views on Vision4Press platform.
Data correspond to usage on the plateform after 2015. The current usage metrics is available 48-96 hours after online publication and is updated daily on week days.
Initial download of the metrics may take a while.