Open Access
Figure 7
Download original image
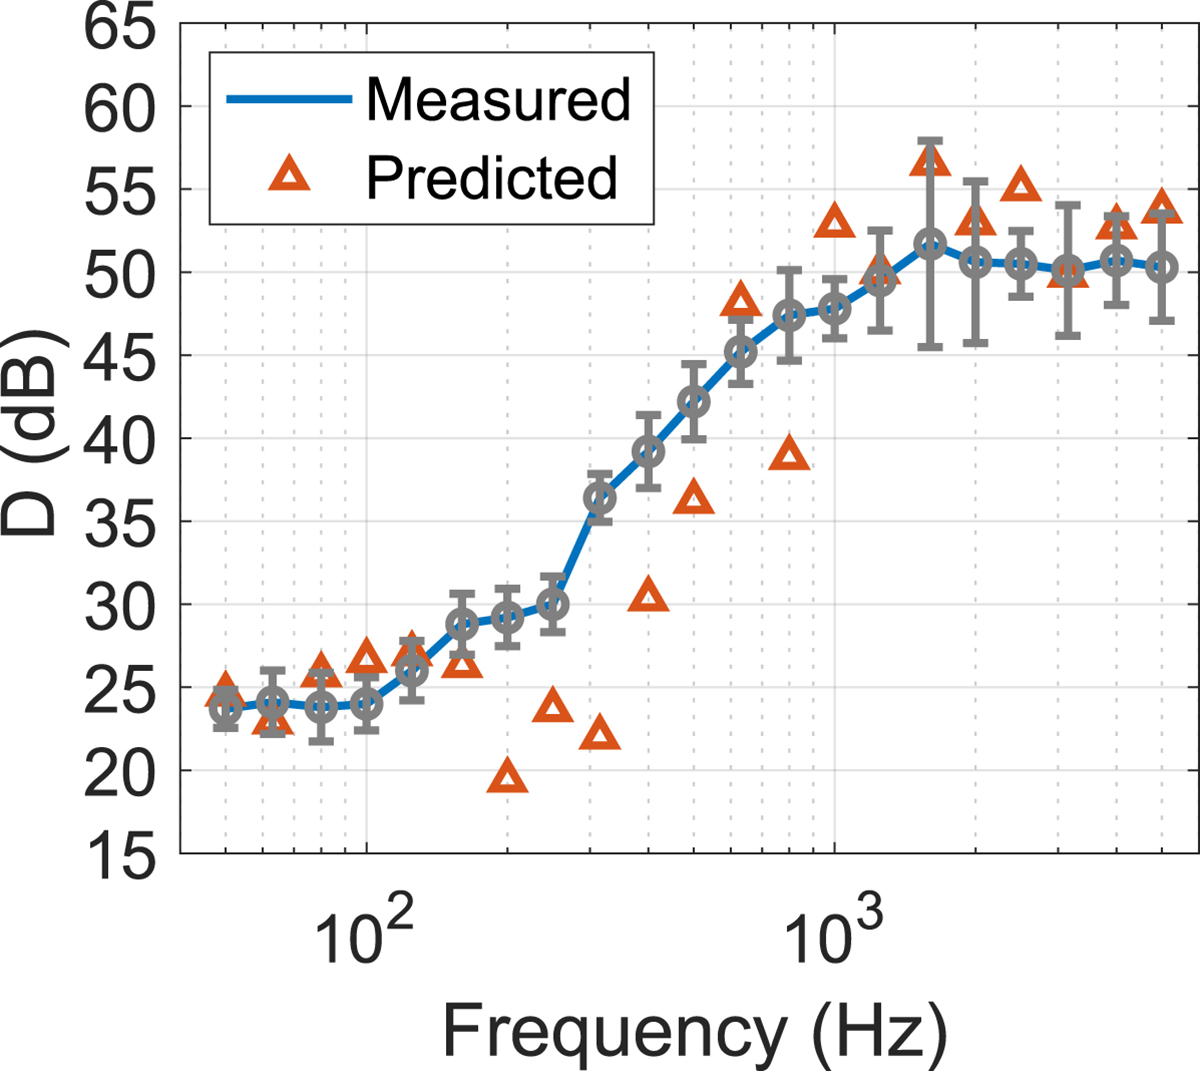
Comparison between the measured and calculated average sound insulation, expressed via the outdoor-indoor level difference (D) across the sound source and receiver positions in 1/3-octave frequency bands. The error-bars denote the 95% Confidence Interval.
Current usage metrics show cumulative count of Article Views (full-text article views including HTML views, PDF and ePub downloads, according to the available data) and Abstracts Views on Vision4Press platform.
Data correspond to usage on the plateform after 2015. The current usage metrics is available 48-96 hours after online publication and is updated daily on week days.
Initial download of the metrics may take a while.