Open Access
Figure S7.
Download original image
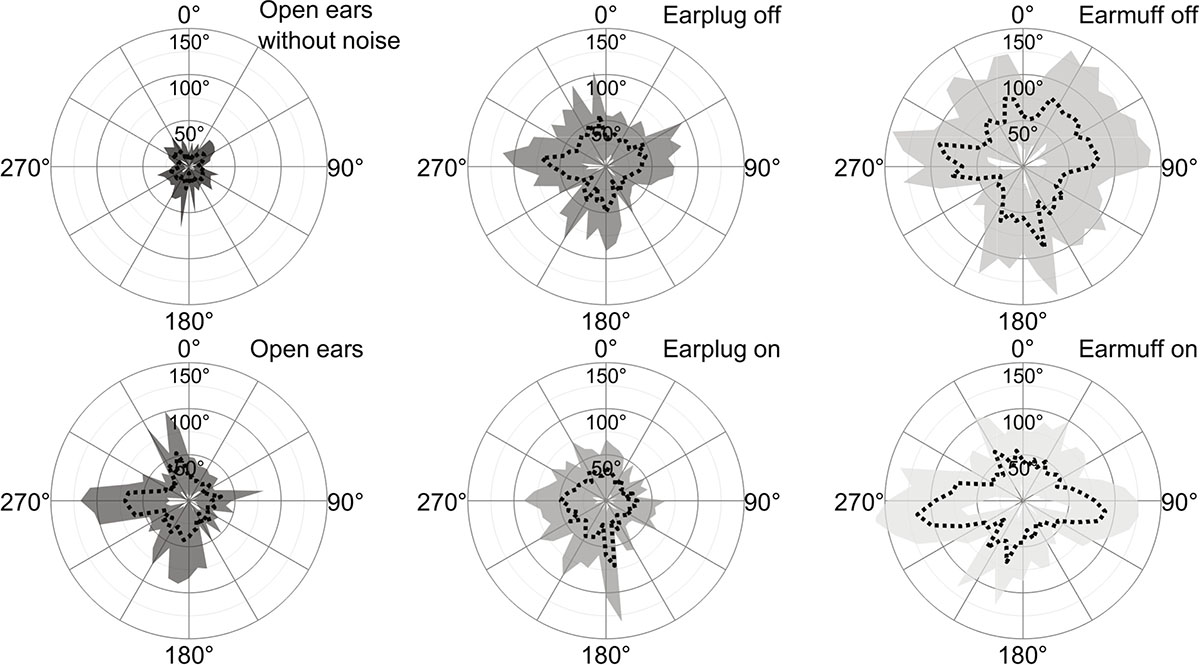
Mean (dashed line) and standard deviation of the angular error distributions with front-back correction for each HPD condition pooled over all participants for the tonal signal at 70 dBA.
Current usage metrics show cumulative count of Article Views (full-text article views including HTML views, PDF and ePub downloads, according to the available data) and Abstracts Views on Vision4Press platform.
Data correspond to usage on the plateform after 2015. The current usage metrics is available 48-96 hours after online publication and is updated daily on week days.
Initial download of the metrics may take a while.