| Issue |
Acta Acust.
Volume 10, 2026
|
|
|---|---|---|
| Article Number | 9 | |
| Number of page(s) | 16 | |
| Section | Hearing, Audiology and Psychoacoustics | |
| DOI | https://doi.org/10.1051/aacus/2026002 | |
| Published online | 18 February 2026 | |
Supplementary material
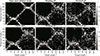 |
Figure S1. Heatmaps of all HPD conditions and participants for the multi-tone signal played back at 70 dB(A). Gray-scaled pixels indicate the relative frequencies of the participants‘ responses plotted against the true target angles. |
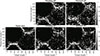 |
Figure S2. Heatmaps of all HPD conditions and participants for the multi-tone signal played back at 85 dB(A). Gray-scaled pixels indicate the relative frequencies of the participants‘ responses plotted against the true target angles. |
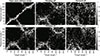 |
Figure S3. Heatmaps of all HPD conditions and participants for the tonal signal played back at 70 dB(A). Gray-scaled pixels indicate the relative frequencies of the participants‘ responses plotted against the true target angles. |
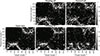 |
Figure S4. Heatmaps of all HPD conditions and participants for the tonal signal played back at 85 dB(A). Gray-scaled pixels indicate the relative frequencies of the participants‘ responses plotted against the true target angles. |
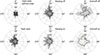 |
Figure S5. Mean (dashed line) and standard deviation of the angular error distributions with front-back correction for each HPD condition pooled over all participants for the multi-tone signal at 70 dBA. |
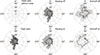 |
Figure S6. Mean (dashed line) and standard deviation of the angular error distributions with front-back correction for each HPD condition pooled over all participants for the multi-tone signal at 85 dBA. |
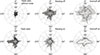 |
Figure S7. Mean (dashed line) and standard deviation of the angular error distributions with front-back correction for each HPD condition pooled over all participants for the tonal signal at 70 dBA. |
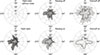 |
Figure S8. Mean (dashed line) and standard deviation of the angular error distributions with front-back correction for each HPD condition pooled over all participants for the tonal signal at 85 dBA. |
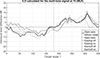 |
Figure S9. Calculated ILDs for each HPD condition for the multi-tone signal at 70 dB(A), either calculated out of the clean target signals (open ears, no background noise) or extracted by the phase-inversion method. |
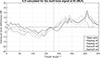 |
Figure S10. Calculated ILDs for each HPD condition for the multi-tone signal at 85 dB(A), calculated out of the extracted target signals by the phase-inversion method. |
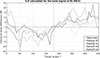 |
Figure S11. Calculated ILDs for each HPD condition for the tonal signal at 85 dB(A), calculated out of the extracted target signals by the phase-inversion method. |
© The Author(s), Published by EDP Sciences, 2026
Current usage metrics show cumulative count of Article Views (full-text article views including HTML views, PDF and ePub downloads, according to the available data) and Abstracts Views on Vision4Press platform.
Data correspond to usage on the plateform after 2015. The current usage metrics is available 48-96 hours after online publication and is updated daily on week days.
Initial download of the metrics may take a while.