Open Access
Figure 13
Download original image
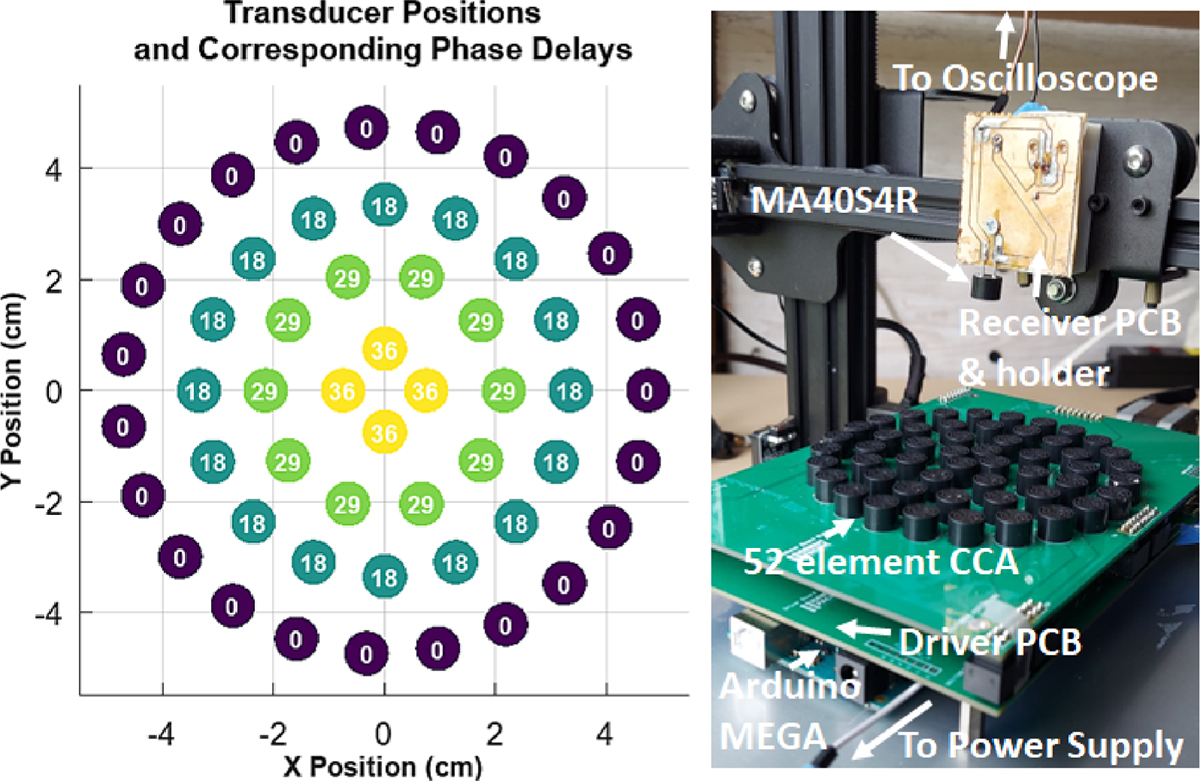
CCA Experiment Setup: CCA transducer rings and corresponding rounded time delays derived from simulations in microseconds for activating each transducer (L). This scheme was implemented for the results shown in Figure 14, as measured from CCA PCB stack on X Y Z stage with receiver PCB (R).
Current usage metrics show cumulative count of Article Views (full-text article views including HTML views, PDF and ePub downloads, according to the available data) and Abstracts Views on Vision4Press platform.
Data correspond to usage on the plateform after 2015. The current usage metrics is available 48-96 hours after online publication and is updated daily on week days.
Initial download of the metrics may take a while.