


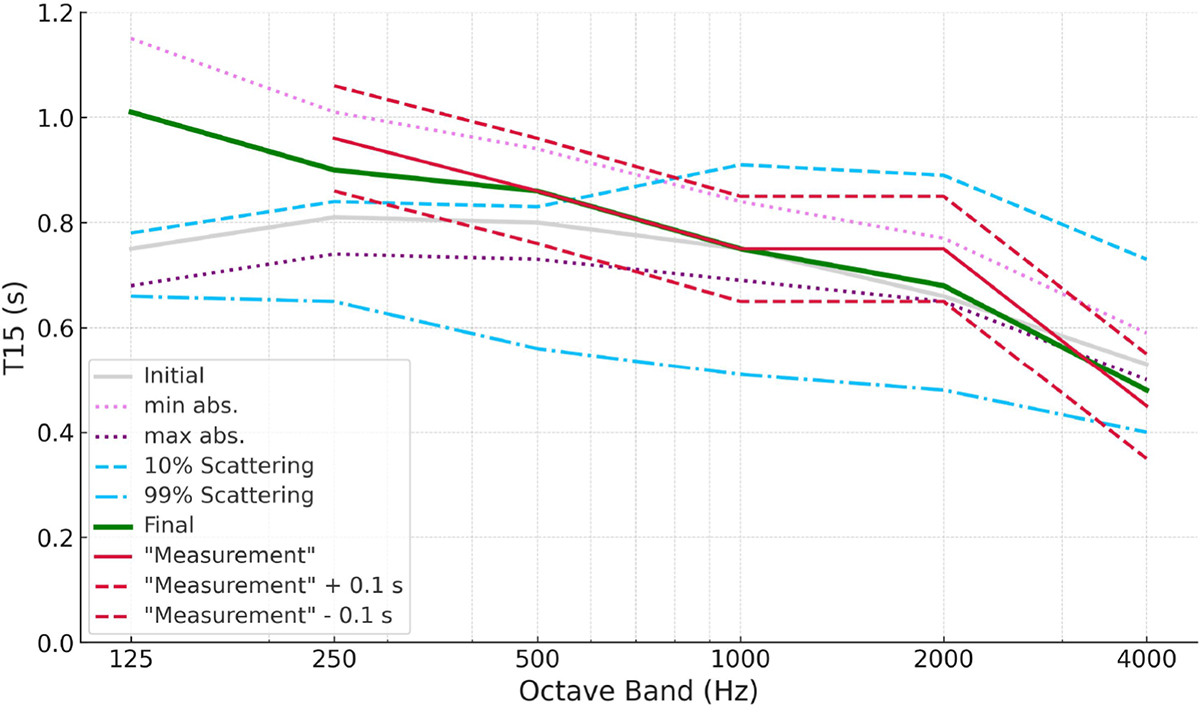
Figure 5.
Download original image
Reverberation time T15 across octave bands (125 to 4000 Hz) for various configurations. The “Initial” shows the T15 for the original configuration. The minimum and maximum values reflect the modeled acoustic extremes for absorption. The “10% scattering” and “99% scattering” lines show the T15 results for the initial model with the scattering set to these values. “Measurement” refers to the measured values, with +/−0.1 s envelopes indicating uncertainty bounds.
Current usage metrics show cumulative count of Article Views (full-text article views including HTML views, PDF and ePub downloads, according to the available data) and Abstracts Views on Vision4Press platform.
Data correspond to usage on the plateform after 2015. The current usage metrics is available 48-96 hours after online publication and is updated daily on week days.
Initial download of the metrics may take a while.