


| Issue |
Acta Acust.
Volume 10, 2026
|
|
|---|---|---|
| Article Number | 68 | |
| Number of page(s) | 13 | |
| Section | History of Acoustics | |
| DOI | https://doi.org/10.1051/aacus/2026074 | |
| Published online | 24 July 2026 | |
Scientific Article
A room acoustic calibration method for vanished architectural spaces using archival sound: A case study of the Bürgerbräukeller (1885–1979)
dieBauingenieure – Bauphysik GmbH, Karlsruhe, Germany
* Corresponding author: This email address is being protected from spambots. You need JavaScript enabled to view it.
Received:
29
May
2025
Accepted:
6
July
2026
Abstract
Virtual reality auralizations offer the opportunity to interactively explore historic buildings and sites through immersive auditory experiences. In the context of historic auralizations, the calibration of room acoustic simulation models is often essential to achieve a realistic representation of the original acoustical environment. This paper presents a systematic calibration procedure for geometrical acoustics models of buildings that no longer exist, provided that an archival audio recording is available which allows for the estimation of reverberation times. By leveraging room acoustics prediction software based on geometrical acoustics, the procedure enables the creation of historically informed virtual acoustic environments, or auralizations. To develop and validate this method, a geometrical acoustic model of the Bürgerbräukeller in Munich (1885–1979) was calibrated using a historical sound recording of a speech delivered in 1939. The proposed calibration approach allows for the reconstruction of the historical soundscape of the Bürgerbräukeller during significant events – most notably the Beer Hall Putsch of 1923 – offering new insights into the auditory dimension of its history.
Key words: Architectural acoustics / Simulation / Auralization / Archeoacoustics
© The Author(s), Published by EDP Sciences, 2026
 This is an Open Access article distributed under the terms of the Creative Commons Attribution License (https://creativecommons.org/licenses/by/4.0), which permits unrestricted use, distribution, and reproduction in any medium, provided the original work is properly cited.
1 Introduction
The Bürgerbräukeller in Munich is significant for key events in Germany’s history. Most notably, it was the site of Adolf Hitler’s 1923 Beer Hall Putsch, an early failed attempt to seize power. Additionally, on November 8, 1939, Georg Elser, a German carpenter, carried out an assassination attempt on Hitler by planting a bomb in the hall. The bomb detonated shortly after Hitler had left, narrowly missing him.
Future studies have expressed interest in reconstructing the historical soundscape of the Bürgerbräukeller during key events, such as the 1923 Beer Hall Putsch. Understanding the acoustics of the room at the time could provide valuable insights into how speeches and crowd dynamics influenced the unfolding of events. Acoustic modeling of this space aims to simulate the auditory experience of historical moments, requiring a detailed model to account for the complex interactions between sound reflections and absorptive surfaces present in the original architecture.
To reconstruct the acoustics of former spaces, it is essential to develop and calibrate an accurate model [1]. While geometrical acoustics (GA) software is widely used for simulating room acoustics in complex geometries, not all tools can precisely model intricate acoustic conditions, particularly when diffuse sound fields cannot be assumed. Wave-based methods, although theoretically advantageous, face challenges due to high computational costs, the need for detailed models, complex input requirements [2], and difficulties in accurately simulating late reverberation in complex spaces [3].
If the building still exists, the optimal calibration approach involves conducting measurements, developing a corresponding room acoustic model, and adjusting the parameters to reflect the historical configurations [4–8]. However, when the building is no longer existing, alternative methods must be applied. In the ideal scenario, archived room impulse responses (RIRs) are available. For example, in the study of the Fogg Art Museum, where Wallace C. Sabine conducted his first reverberation tests, calibration was based on balloon measurements of a later configuration before the hall’s demolition in 1973. The GA model was then returned to its former state during Sabine’s tests, resulting in observations consistent with documented critiques of speech intelligibility [9].
Another approach uses previously reported room acoustic parameters, though variations in measurement protocols and analysis methods may limit reliability. In a study of two historic Gewandhaus concert halls in Leipzig, calibration relied on reverberation time data recorded in 1933 [10]. Similarly, the reconstruction of the Palais du Trocadéro (1878–1937) utilized acoustic measurements published in 1906. These measurements included unoccupied and occupied conditions, using an “artificial mouth” source consisting of an air supply, rotating perforated wheel, and mouth resonator [11]. The GA model was calibrated with special attention to the absorbing properties of “stuffed cloth” draping the audience area.
When no acoustic parameters are available, calibration must depend solely on descriptive historical documents. This introduces uncertainties related to interpretation and bias. GA models in such cases are often best described as historically informed rather than strictly calibrated. Similar to historically informed performance (HIP) in musicology, these models may not produce absolute results but are valuable for studying variations around a reference model. For example, Vissilantonopoulos and Mourjopoulos [12] developed auralizations of lost spaces based on architectural drawings and historical descriptions. In one case, the Acheron Necromancy, known for speech-based rituals, was hypothesized to have “dry” acoustics to ensure intelligibility across listener positions. Conversely, in the Olympia echo hall, the well-known seven-fold echo allowed sufficient speech clarity only within 5 m of the speaker. Further studies [13, 14] developed auralizations of lost Finnish theatres by modeling based on building plans, assigning absorption coefficients from photographic analysis and scattering coefficients according to [15]. Perceptual calibration was achieved through historical accounts, including newspaper descriptions.
In cases without acoustic data, calibration relies entirely on material research and descriptive accounts, increasing uncertainty due to variations in material properties and the performance of GA simulations regarding scattering and late reflections. In these situations, comparative studies of model variants often yield more reliable insights than absolute predictions. To avoid these problems, a previous study [16] applied a broad calibration approach using informed estimations of material acoustic properties. Simulations focused on relative differences between model variations rather than absolute results, with particular attention to the early response (0 ms to 250 ms) rather than late reverberation. The simulation study followed these steps:
-
The geometrical model was constructed based on available documentation.
-
Materials were identified through archival research.
-
Absorption coefficients were gathered from databases, with variations across sources used to define reasonable ranges. Simulations were performed for both maximum and minimum absorption coefficients, following recommendations from [17].
Where sound anomalies, such as focusing or echoes, appeared in both extreme simulation conditions, it was inferred that similar effects likely occurred in the original hall.
However, when studying the role of the room acoustics during key events in history, such as the 1923 Beer Hall Putsch, a certain degree of certainty about the acoustics needs to be acquired, making the reference of some reverberation time reference necessary. In this study, we are creating and calibrating a room acoustic model of the Bürgerbräukeller for historical and acoustic research purposes, based on snippets from an archival audio recording made in the hall. These snippets contain grouped audience utterences and subsequent silence that enables studying the room’s acoustic response. To the authors’ best knowledge, no previous study has performed a calibration based on similar audio data.
The article is organized as follows: Section 2 provides detailed information on the hall’s architecture and history, Section 3 describes the analysis of the sound file and reverberation estimation, Section 4 outlines the development of the room acoustic model, Section 5 shows the actual calibration as performed on the model of the Bürgerbräukeller, and Section 6 presents a simplified case study of a possible event during the Beer Hall Putsch utilizing the calibrated model.
2 The Bürgerbräukeller
2.1 The buildings history
The Bürgerbräukeller was a restaurant cellar in Munich from 1885 to 1979. It was a large beer hall, behind the Gasteig cultural center, popular for political events during the Weimar Republic. On November 8, 1923, Bavarian State Commissioner General Gustav von Kahr held a large assembly in the overcrowded hall, which was stormed by Adolf Hitler, Erich Ludendorff, Hermann Göring, and other National Socialists. This event marked the beginning of the “March to the Feldherrnhalle” on the morning of November 9, 1923 – the failed Beer Hall Putsch.
Starting in 1933, Hitler delivered a speech at the Bürgerbräukeller every November 8 to commemorate the putsch attempt. On November 8, 1939, he narrowly escaped an assassination attempt by Georg Elser, who had hidden a time bomb inside a pillar behind the speaker’s podium. Elser had set the timer for 9:20 pm, but due to wartime scheduling, the event ended earlier than usual. Hitler concluded his speech at 9 pm and left the hall at 9:07 pm to catch a special train to Berlin. The bomb exploded at 9:20 pm, killing seven NSDAP members and a waitress, and injuring over 60 others.
Shortly after the bombing, Hitler inspected the heavily damaged hall, which was eventually repaired. However, starting in 1940, the annual November 8 speeches were relocated to the Löwenbräukeller at Stiglmaierplatz.
The Bürgerbräukeller was used as a food storage facility until the end of World War II in 1945 and later served as a cafeteria for the U.S. Army. In 1958, it reopened as a large restaurant and event venue. The entire complex was demolished in 1979 to make way for new developments.
2.2 The buildings design
The Bürgerbräukeller was a spacious beer hall designed to accommodate large crowds. The architecture was typical of traditional Bavarian beer halls, featuring high ceilings, long rows of wooden tables, and large support pillars.
It had a long, rectangular shape, allowing for large gatherings and public events. The stage or podium was positioned at one end of the hall. Massive pillars ran along the sides of the hall, supporting the ceiling and partially dividing the space. The hall included balconies or galleries along the sides, providing additional seating. These elevated areas gave some attendees a higher vantage point over the main floor.
2.3 Circumstances on November 8, 1939
The acoustic environment of the Bürgerbräukeller on 8 November 1939 was significantly influenced by both the physical structure of the space and the presence of a large number of spectators. On that particular evening, the venue was filled over its capacity with 3000 attendees gathered to listen to Adolf Hitler’s commemorative speech (see Fig. 1a). Spectators were positioned throughout the main hall, with many seated at large wooden tables arranged in rows, while others stood around the periphery or on balcony levels.
 |
Figure 1. Photos from the Bürgerbräukeller. |
In addition to the crowd, various decorations likely affected the acoustic behavior (see Fig. 1c). Historical accounts suggest that political banners, flags, and other drapery adorned the space, particularly around the speaker’s podium. These fabric materials would have further absorbed high-frequency sound, contributing to an overall reduction in reverberation time.
3 Calibration reference: Reverberation time
3.1 Methodological considerations for reverberation time estimation
This study analyzed an approximately one-hour-long speech by Adolf Hitler [23], recorded on November 8, 1939, just 20 minutes before Georg Elser’s assassination attempt at the Bürgerbräukeller in Munich. While this recording provides a rare opportunity to study the acoustics of a large venue with a live audience, much of the recording is unsuitable for reverberation analysis. Both Hitler and the introductory speaker spoke directly into a microphone, resulting in an excessively high direct-to-reverberant sound ratio. This caused artificially short reverberation times that do not accurately reflect the room’s acoustics.
However, within the hour-long recording, the crowd can be heard shouting “Sieg Heil” in unison nine times, occurring in three sets of three repetitions, with short intervals between each utterance. These vocal outbursts provide a more suitable sound source for analysis, as the voices originate from multiple points in the room, generating a reverberant field more representative of the venue’s acoustics. The repetition of the “Sieg Heil” chants across nine instances also allows for some statistical analysis of the reverberation parameters, improving the reliability of the results.
When using impulse responses (e.g., from balloon bursts or pistol shots), the decay curve typically follows a smooth, exponential pattern starting immediately after the impulse. This pattern allows for accurate estimation of EDT (Early Decay Time), which measures the time for the sound to decay by 10 dB from its peak level. However, the crowd noise in this study exhibited a more complex decay pattern, influenced by the variability in the timing and intensity of individual voices within the crowd.
EDT is particularly sensitive to the early portion of the decay curve, where reflections and energy fluctuations are most pronounced. In this study, early reflections from room surfaces, combined with the irregular timing and intensity of individual voices, caused significant deviations from a smooth exponential decay. These deviations affected the linear fit used to calculate EDT, often leading to unreliable and inconsistent reverberation estimates.
Under ideal conditions, T20 (measuring the decay from −5 dB to −25 dB) or T30 (from −5 dB to −35 dB) would be preferable for estimating reverberation time. These metrics capture a larger portion of the decay curve, making them more resistant to local fluctuations and early reflection artifacts. However, the unique circumstances of this study limited the feasibility of using these longer decay measurements.
Due to the short intervals between successive “Sieg Heil” outbursts, the sound energy did not always have enough time to decay by 20 or 30 dB before the next vocal burst occurred. As a result, in most cases, only a 15 dB decay (from −5 dB to −20 dB) was reliably obtainable. This made T15 the most practical and robust metric for estimating reverberation time. By focusing on the mid-portion of the decay, T15 reduces the impact of early irregularities and provides a more stable estimate of the room’s reverberant behavior.
3.2 Audio analysis
The audio file required denoising to improve clarity and enhance the accuracy of subsequent reverberation analysis. Background noise, including low-frequency hums and high-frequency hissing, can obscure key acoustic data and introduce artifacts that affect measurements. To address this, a noise profile was created by identifying a segment of the recording with only background noise. Using this profile, spectral noise reduction was applied, followed by high-pass and low-pass filtering to remove unwanted frequency components. Dynamic range compression ensured consistent speech volume without amplifying residual noise, while equalization (EQ) enhanced the speech frequencies. Final smoothing was applied to reduce artifacts, resulting in a cleaner audio file.
The reverberation analysis focused on extracting the T15 parameter. The process began with bandpass filtering of the audio file into predefined octave bands (125, 250, 500, 1000, 2000, and 4000 Hz). For each band, the energy of the filtered signal is calculated and then integrated in reverse to generate a cumulative energy curve. This curve is converted to decibels, forming the basis for the decay analysis (Schroeder curve; see Fig. 2a for a typical Schroeder curve and 2b for a typical spectrogram). The portion of the decay between −5 dB and −20 dB was identified to perform a linear regression fit.
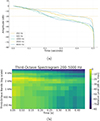 |
Figure 2. (a) Typical Schroeder curves with T15 thresholds, illustrating the decay of amplitude over time for octave bands 250–4000 Hz and (b) Typical third-octave spectrogram for the third-octave bands 200–5000 Hz. |
Despite these efforts, the analysis found that the 125 Hz octave band contained little usable information. This limitation was attributed to the poor low-frequency response of microphone technology used in the 1930s, which rendered decay measurements in this band unreliable and unsuitable for further analysis. This issue highlights the constraints of working with historical audio recordings, where both technological and recording conditions can significantly influence the quality of the data.
3.3 Estimated reverberation time
The nine instances of the “Sieg Heil” outbursts were segmented based on careful listening to the audio file. These segmented events provided the opportunity to perform basic statistical analysis on the reverberation parameters, reducing the impact of anomalies in individual measurements and improving the robustness of the results.
The statistical analysis of the octave band data provides insights into the distribution of reverberation times across different frequency bands. Outliers, all indicating higher reverberation times and suggesting noise in the considered octave band, were omitted from further analysis. The mean reverberation times of the leftover measurements ranged from 0.46 s at 4000 Hz to 0.96 s at 250 Hz, with standard deviations between 0.07 s and 0.12 s (see Fig. 3 and Tab. 1), indicating moderate variability. Lower frequencies, such as 250 Hz and 500 Hz, generally show longer average reverberation times compared to higher frequencies, such as 4000 Hz. This is consistent with typical room acoustics, where lower frequencies often take longer to decay due to less efficient absorption at those frequencies.
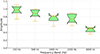 |
Figure 3. Boxplot showing the distribution of T15 results for the nine audience outburst (outliers omitted) across octave bands, excluding 125 Hz. |
Statistical Summary of T15 Octave Band Data in s.
When comparing these results to the Just Noticeable Difference (JND) for reverberation time, studies have shown that the JND is typically around 5% to 10% of the reverberation time [24–26], depending on the frequency and sound source. For example, at a reverberation time of 1 s, a difference of 0.05–0.1 s seconds would be perceptible. In this dataset, most standard deviations are within or close to this perceptibility threshold, suggesting that some variations within the same frequency band may be noticeable to listeners.
4 Initial acoustic model creation
4.1 Geometrical model and simulation
GA model creation were performed and simulation were run using CATT-Acoustic (v.9.1.g, TUCT v2), a software package previously shown to be capable of creating accurate and realistic room acoustic simulations, both via objective and perceptual analysis [27].
The dimensions and layout of the hall were reconstructed based on archival photographs (see Fig. 1). The modeled geometry (see Fig. 4) measured 41 m in length, 21.5 m in width, and 6.5 m in height. Two rows of six pillars, each 1.0 m wide, were modeled symmetrically, positioned 1.75 m from the side walls and spaced 7.0 m apart. Additionally, two more pillars of the same width were placed near the entrance and the stage, based on photographic evidence.
 |
Figure 4. Geometric model of the Bürgerbräukeller. The figure shows top, side, and front projections (left), as well as a 3D perspective view (bottom right). Red markers indicate source positions (S0–S9), and the blue marker shows the receiver position at the historical microphone location. |
The model was designed to reproduce the acoustic conditions as accurately as possible at the moment of the grouped utterances. Instead the actual stage, Hitler was positioned on a specifically erected little stage at the third pillar on the left when viewed from the entrance. Photographs from 1938 (see Figs. 4a and 4b) indicate that banners were hung in front of this pillar as well as in front of those near the entrance. Large flags were suspended in front of the other pillars, excluding the two closest to the stage and those located in the corners.
On the night of 8 November 1939, more than 3000 individuals were present in the Bürgerbräukeller. Given the cold season, the audience wore thick clothing, and it was common to stand during the collective speaking moments. Therefore, the audience was modeled as 1.6 m high.
One receiver position was modeled at the location of the historical microphone, directly in front of Hitler’s mouth. Ten source positions were distributed throughout the hall to simulate the spatial characteristics of the grouped speaking. For calibration, the summed impulse responses from all sources were used to compare against the “measured” reverberation times.
The geometrical model remained unchanged throughout the calibration process. It consisted of 597 polygons and enclosed a volume of approximately 4400 m3. Simulations were carried out using algorithm 1 (short calculation, basic auralization), max split-order 1 with 1 × 10⁶ rays and an impulse response length of 1 s for both parameter mapping and impulse response generation.
4.2 Initial configuration
In order to obtain the most realistic acoustic conditions, careful consideration was given to the materials’ sound absorption coefficients. The attribution of absorption coefficients was based on general published data sources [28–30]. The variation across data for comparable materials aided in defining a reasonable range of values for which simulations were made using the extents of likely absorption coefficients. Information on specific materials is provided below, with a summary of attributed acoustic material properties given in Table 2.
Absorption coefficients, chardepth (c d, mm) as the single value using equation (1), and associated surface area (m2) in the calibrated GA model. † have defined scattering coefficients of [30%,40%,50%,60%,70%,80%]. When no final absorption coefficients are depicted, they were left unchanged during the calibration.
-
Audience: The absorption coefficients for the standing audience were estimated by referencing standardized absorption values per person wearing thick clothing, based on data from [31] reverberation chamber tests and classic acoustic literature [32, 33]. Standing individuals typically contribute less absorption than seated ones, due to reduced contact with absorbing surfaces such as upholstered chairs and a more vertical posture. To obtain coefficients per square meter of floor area, the absorption area per person – ranging from 0.22 m2 at 125 Hz to 0.42 m2 at 4000 Hz – was divided by the assumed spatial density of 0.5 m2/person, representing a densely packed standing audience.
-
Floor: The absorption coefficients for a wooden floor installed over joists were obtained from standardized laboratory measurements provided [29]. This configuration, involving timber boards mounted on joists, exhibits moderate sound absorption.
-
Plaster: The absorption coefficients of plaster depend significantly on the underlying construction. Traditional plaster applied over a deep air cavity can exhibit relatively high absorption, particularly in the lower octave bands, whereas plaster applied directly to masonry tends to have much lower absorption values [29]. Since the substructure was not discernible from the photographs, a deliberately broad range of absorption coefficients was assumed.
-
Stucco: The sound absorption coefficients for stucco were adopted from [33], who provides measured data for typical hard interior finishes. Stucco, when applied as a smooth, dense plaster (e.g., cement or lime-based) directly onto masonry. This was employed for the pillars and ceiling beams. Additionally, “edge diffusion” was applied to these surfaces to account for low- and mid-frequency diffraction at beam and pillar edges, which are otherwise not captured by ray-based simulations. This practice aligns with recommendations by Vorländer [28] for treating occluded geometries in GA modeling.
-
Glass: The sound absorption coefficients for single glazing were taken from [29] (Single-pane glass (6 mm thick, rigidly mounted)), who compiled standardized measurements of common architectural materials.
-
Banners and flags: The absorption coefficients was based on [33] “Fabric Banner, free-hanging”. They were simulated as 50% acoustically transparent.
The frequency-dependent scattering coefficient (scattcoef) can be roughly estimated as a function of a given characteristic depth (chardepth) representative of the surface’s depth variations or roughness. The estimation algorithm in equation (1), available in CATT-Acoustic by the estimate function, can be used, as well as specific values being directly assigned as a function of frequency.
 (1)
(1)
where λ is the wavelength. This method of defining scattcoef was selected for first approximations as it provides a more intuitive and physically relevant control parameter and reduces the possibility of creating unrealistic frequency variations in scattering properties for general materials with scattering increasing with frequency.
The scattcoef of the audience were defined following the guidelines in the CATT-Acoustic manual, which recommends that these be modeled with scattcoef of 30–80%, rising 10% per octave band [34, p.85]. These were left unchanged during the course of the calibration. For the other surfaces, the chardepth was estimated from the photos (see Fig. 1). As this method does not provide absolute certainty, a range for chardepth was established for each material and used during the calibration.
5 Calibration
5.1 Calibration approach
The calibration method was based on the six-step approach presented in [1]:
-
Identification of relevant absorption coefficients from various databases of materials. The variation among data for comparable materials aides in defining a reasonable range of values which can be used in the calibration process.
-
Running 10 repetitions of the initial simulation configuration, analysis of the average of the SD calculated per position for each acoustic parameter quantifies the run-to-run variation for the given GA model.
-
The sensitivity of the GA model to the scattering coefficient is investigated. Simulations are run of the initial GA model followed by simulations with all scattering coefficients set to 10% and then to 99%, with all absorption coefficients unchanged.
-
Absorption coefficients are adjusted to bring the reverberation parameters within 1 JND of the measured value. The first materials to be adjusted are those with the largest surface areas, since small variations lead to considerable effects.
-
Based on the results of step 3, the scattering coefficients are adjusted to calibrate the average clarity parameters to within 1 JND of the measured values.
-
Having calibrated the average parameter values, the final step refines the calibration by minimizing the SD of the differences between simulated and measured parameters, considering all source-receiver positions. This step is accomplished by examining the results for each position and making local adjustments to predominant surface properties relative to source and receiver positions while assuring the previous calibration steps’ results concerning mean values are not altered.
This calibration approach was adjusted as it is impossible to obtain realistic clarity estimations from the audio snippets and the reverberation time was determined at only one receiver position. Therefore, steps 5 and 6 were omitted from the process. In between steps 2 and 3 simulations were run with the maximum and minimum absorption found in step 1, since one of the study’s goals was to test the validity of the reverberation estimation (T15).
For step 4 the calibration aim was +/− 0.1 s. This corresponds to 1 JND (10%) of the reverberation time at 1.0 s and the standard deviation found in the statistical analysis of the utterances of the audience.
5.2 Calibration results
According to the calibration approach, the run-to-run variation was determined from ten repeated simulations first (step 4; see Tab. 3). As this was significantly lower than the calibration aim of 0.1 s, the subsequent results present a single simulation.
Average and standard deviation (here defined as run-to-run variaton) from 10 simulations of the initial configuration.
Figure 5 presents the results of the initial simulation model and compares them to the T15 values derived from the audio recording. For four out of the five evaluated octave bands (500 Hz to 4000 Hz), the initial simulation results fell within the targeted calibration range. The simulation based on the absorption coefficient range (step 5) confirmed that the T15 obtained from the audio file was well encompassed by the range of reverberation times resulting from the minimum and maximum absorption assumptions. Subsequent simulations incorporating the 10% and 99% scattering coefficients (step 6) revealed a notable sensitivity of the model to changes in scattering. Specifically, increasing the scattering coefficient led to shorter reverberation times, while decreasing it resulted in longer reverberation times. This indicates that surface diffusion plays a non-negligible role in the acoustic response of the modeled space and must be considered carefully in calibration.
 |
Figure 5. Reverberation time T15 across octave bands (125 to 4000 Hz) for various configurations. The “Initial” shows the T15 for the original configuration. The minimum and maximum values reflect the modeled acoustic extremes for absorption. The “10% scattering” and “99% scattering” lines show the T15 results for the initial model with the scattering set to these values. “Measurement” refers to the measured values, with +/−0.1 s envelopes indicating uncertainty bounds. |
At the start of step 7 (adjusting the scattering and absorption coefficients), three surfaces were considered for adjustments based on their size: audience, plaster, and floor. As the floor is mainly covered by the audience, adjusting its parameters was deemed useless. Whereas the absorption and scattering ranges for the audience was narrow, the ranges for the plaster were wider because of the unkwown underconstruction. Therefore, the parameter adjustments started with the plaster.
The T15 value in the initial simulation exceeded the measured value in the 4000 Hz octave band by 0.08 s. Although this discrepancy remained within the acceptable calibration range, further adjustments were undertaken to reduce the deviation and better align the simulation with the determined average. To achieve this, the chardepth parameter of the plaster material was increased, which effectively raised the scattering coefficient – particularly at higher frequencies – thereby reducing the simulated reverberation time in the 4000 Hz band. This adjustment is supported by visual evidence: as shown in Figure 1e, various decorative elements are present on the ceiling. Their scattering contribution may have been underestimated in the initial model. A similar uncertainty applies to the wall surfaces, for which no high-resolution or close-up photographs could be obtained during the course of this study. It is therefore possible that the scattering effects of architectural or furnishing elements were systematically underestimated, and the increased chardepth serves to partially compensate for this limitation in the visual documentation and geometric detailing of the model.
The T15 values in the initial simulation were too short for the 250, 500, and 2000 Hz octave bands, with deviations of −0.15 s, −0.06 s, and −0.09 s, respectively. The deviation at 250 Hz exceeded the acceptable calibration range, while the discrepancies at 500 and 2000 Hz remained within tolerable bounds. Given that the initial absorption coefficients assigned to plaster were relatively high – particularly in the lower frequency range – they were systematically reduced. Initially, the absorption characteristics resembled those of plaster on lath, which is more absorptive. In the final configuration, the material properties were adjusted to approximate those of plaster (gypsum or lime, on masonry), which apparently better matched the historical construction and acoustic behavior. Additional refinements were made by modifying the absorption coefficients of the audience area, contributing to a more balanced reverberation response across all critical octave bands.
The final set of material characteristics yielded reverberation times that more closely matched those estimated from the grouped utterances than the initial configuration (250 Hz = −0.06 s; 500 Hz = +0.00 s; 1000 Hz = +0.00 s; 2000 Hz = −0.07 s; 4000 Hz = +0.03 s; see Fig. 5). Since all remaining discrepancies fall within the defined calibration bounds, the model is considered sufficiently calibrated. This provides a robust basis for assuming that the resulting auralizations are ecologically valid and perceptually plausible representations of the original acoustical environment.
6 Case study
The model was subsequently adapted to represent Gustav von Kahr delivering a speech from the original speaker’s position on the hall’s stage, as it was presumed to have been arranged just before Hitler and his co-conspirators marched in to initiate the Beer Hall Putsch. The audience density remained unchanged; however, the heigth of the audience was modified to reflect a sitting audience, resulting in an average listener height of approximately 1.2 m. All temporary elements associated with Hitler’s later appearances – such as banners, flags, and the specially constructed stage – were removed from the model to reflect the presumed spatial and visual conditions of the 1923 event more accurately.
A sound source exhibiting the directivity pattern of a speaking person, based on [35] and representing a “normal speaking male”, was placed at the center of the actual stage. Simulations were carried out using map measures with 2 × 10⁶ rays and an impulse response length of 1 s with all horizontal audience areas on the ground floor as receivers. The background noise was set to 125 Hz = 45 dB; 250 Hz = 38 dB; 500 Hz = 32 dB; 1000 Hz = 28 dB; 2000 Hz = 25 dB; 4000 Hz = 23 dB assuming a silent audience.
In order to judge the speech intelligibility of the model, the Speech Transmission Index (STI), a standardized metric to quantify speech intelligibility in acoustical environments, employed. It ranges from 0 (no intelligibility) to 1 (perfect intelligibility) and is derived by analyzing how a modulated speech signal is affected by the transmission path between source and receiver, including reverberation, background noise, and spectral coloration [36]. STI values are interpreted according to intelligibility classes: values above 0.75 are considered “excellent”, 0.60–0.75 “good”, 0.45–0.60 “fair”, and below 0.45 “poor”.
Figure 6 illustrates the simulated STI in the hall. The STI drops below the “good” rating after the third pillar and remains in the “fair” to “poor” range for the remainder of the audience area. From a contemporary acoustic perspective, this would render the hall suboptimal for speech-focused events, particularly without electronic amplification.
 |
Figure 6. Simulation results for speech intelligibility (STI) in the assumed 1923 configuration of the Bürgerbräukeller. |
These results prompt several historically relevant room acoustics questions:
-
It is noteworthy that Adolf Hitler’s actual speaking position deviated from the original stage location. Instead, he addressed the audience from a point further into the hall, near the third pillar. This relocation may have been a deliberate response to acoustic challenges, chosen to improve overall speech intelligibility. Such a decision would suggest a perceptive awareness – whether intuitive or advised – of the room’s acoustic behavior during earlier public gatherings.
-
During commemorative events for the Beer Hall Putsch, the hall was extensively decorated with banners, flags, and drapery. While these elements served clear symbolic and visual functions, it is plausible that they also contributed acoustically, for instance by increasing high-frequency absorption or reducing flutter echoes. Whether this acoustic side effect was intentional or incidental remains an open question and warrants further investigation.
The case study presented here offers a simplified representation of a highly complex sequence of events that took place on November 8, 1923. A more comprehensive future study will aim to reconstruct the acoustic conditions of the evening in greater detail, including a minute-by-minute analysis that incorporates the actual background noise as well as dynamic source, receiver and audience behavior. Gaining a deeper understanding of the room’s acoustics at the time may yield valuable insights into how speech intelligibility, sound propagation, and crowd acoustics potentially influenced the perception, reception, and escalation of the events as they unfolded.
7 Discussion
This study demonstrates a novel calibration methodology for geometrical acoustic (GA) models of vanished spaces, anchored in the use of archival audio recordings. While the challenges of working with historic data are substantial – ranging from limited architectural documentation to degraded audio fidelity – this approach shows that meaningful acoustic insights can still be recovered. In summary, this seven step calibration is proposed:
-
Identification of a relevant sound file that is suitable for reverberation analysis. e.g., grouped audience utterences that are stopped relatively in unison, pistol shots, a dropped book, etc. It is advantageous when this sound is present more than once in the audio file, giving the chance for statistical analysis.
-
A geometrical model of the considered space is created and the situation from step 1 is recreated as close as possible. This model remains unchanged during the course of the calibration.
-
Identification of relevant absorption coefficients from various materials databases. The variation among data for comparable materials aides in defining a reasonable range of values which can be used in the calibration process.
-
Running 10 repetitions of the initial simulation configuration, analysis of the average of the SD calculated per position for each acoustic parameter quantifies the run-to-run variation for the given GA model.
-
The sensitivity of the GA model to the sound absorption coefficient is investigated. Simulations are run with the minimum and maximum absorption coefficients as determined in step 2, with all scattering coefficients unchanged.
-
The sensitivity of the GA model to the scattering coefficient is investigated. Simulations are run with all scattering coefficients set to 10% and then to 99%, with all absorption coefficients unchanged.
-
Absorption and scattering coefficients are adjusted to bring the reverberation parameters within a reasonable range of the determined reverberation time. The first materials to be adjusted are those with the largest surface areas, since small variations lead to considerable effects.
The proposed calibration process adapts and simplifies existing frameworks to accommodate the specific limitations of historic reconstructions. In particular, the focus on T15 reverberation time, extracted from grouped audience utterances, proved to be a practical compromise between data availability and methodological rigor. Although clarity-based metrics such as C50 and C80 could not be reliably evaluated from the archival audio, the T15 parameter provided sufficient constraint for material and model tuning.
Importantly, the process acknowledged uncertainty by simulating both upper and lower bounds of material absorption, and by testing the sensitivity of the model to scattering coefficients. This dual-bounded approach allows conclusions to be framed within a range, rather than as absolute predictions – a principle aligned with other studies in historical acoustics.
7.1 Limitations
-
Reverberation data is based on indirect speech signals rather than impulse responses.
-
Microphone placement and recording quality introduce unknown filtering effects.
-
Scattering and absorption coefficients rely on material assumptions with limited visual and documentary evidence.
7.2 Strengths
-
First known application of archival audio to calibrate a room acoustic model of a non-existent building.
-
Demonstrates methodological robustness through sensitivity and uncertainty analysis.
-
Enables acoustically plausible auralizations for historical interpretation.
8 Conclusion
This study introduces a systematic approach for calibrating geometrical acoustics models of historical venues that no longer exist, using reverberation time estimates derived from archival audio recordings. Applied to the case of the Bürgerbräukeller in Munich, the method successfully produced a model with reverberation characteristics closely aligned with those inferred from the 1939 recording.
The presented approach expands the methodological toolkit of architectural acoustics and heritage research by enabling historically grounded auralizations, even in the absence of physical measurements. It offers a replicable framework for future reconstructions of vanished acoustic environments, particularly where audio documents remain.
In forthcoming studies, the calibrated model will be used to simulate the soundscape during the 1923 Beer Hall Putsch. This will provide valuable insights into how the acoustic conditions of the hall may have influenced speech intelligibility, perception, and ultimately the course of events during that pivotal night in German history.
8.1 Ethical considerations
The Bürgerbräukeller is inextricably linked to some of the darkest chapters of 20th-century history. As the site of the failed 1923 Beer Hall Putsch and Adolf Hitler’s annual commemorative speeches, it played a symbolic and functional role in the rise of the Nazi regime. Any scholarly effort to reconstruct its spatial or acoustic environment must therefore confront the ethical implications of reviving a space so closely associated with political extremism, violence, and propaganda.
This study approaches the reconstruction of the Bürgerbräukeller not as an act of commemoration or architectural nostalgia, but as a tool for critical historical analysis. The aim is to deepen our understanding of how the physical and acoustic characteristics of this environment may have shaped the experience of those events–particularly the perception and intelligibility of political speech. By focusing on the material and auditory realities of the space, the project contributes to a historically grounded critique of the mechanisms of persuasion and control in mass political gatherings.
Nevertheless, the potential for misuse of such reconstructions – whether through decontextualized media representations or ideological appropriation – cannot be ignored. To mitigate these risks, it is essential that all reconstructions and public-facing outputs be presented with clear historical framing and scholarly intent. The model should serve as a didactic instrument, not a vehicle for mythologizing or aestheticizing the past.
The author recognizes that working with such material requires not only scientific rigor, but ethical responsibility. Future dissemination of this work will be guided by the principles of historical accountability, contextual sensitivity, and critical engagement.
Conflicts of interest
The authors declare that they have no conflicts of interest in relation to this article.
Data availability statement
Data are available on request from the author.
References
- B. Postma, B. Katz: Creation and calibration method of virtual acoustic models for historic auralizations. Virtual Reality 19, SI: Spatial Sound (2015) 161–180. [Google Scholar]
- S. Siltanen, T. Lokki, L. Savioja: Rays or waves? Understanding the strengths and weaknesses of computational room acoustics modeling techniques, in: Proceedings of the International Symposium on Room Acoustics (ISRA), 2010, pp. 1–6. [Google Scholar]
- P. Luizard, M. Otani, J. Botts, L. Savioja, B. Katz: Comparison of sound field measurements and predictions in coupled volumes between numerical methods and scale model measurements. Proceedings of Meetings on Acoustics 19, 1 (2013) 1–9. [Google Scholar]
- S. Weinzierl, P. Sanvito, F. Schultz, C. Büttner: The acoustics of renaissance theatres in Italy. Acta Acustica united with Acustica 101, 3 (2015) 632–641. [CrossRef] [Google Scholar]
- J.-H. Rindel, M. Lisa: The erato project and its contribution to our unerstanding of the acoustics of ancient greek and roman theaters, in: ERATO Project Symposium, 2006. [Google Scholar]
- D. Murphy, S. Shelley, A. Foteinou, J. Brereton, H. Daffern: Acoustic heritage and audio creativity: the creative application of sound in the representation, understanding and experience of past environments. Internet Archaeology Special issue (2016) 1–23. DOI: https://doi.org/10.11141/ia.44.12. [Google Scholar]
- F. Garcia, A. Planells, S. Cerdá, R. Montell, A. Giménez: Archeological acoustics of the venue of the misteri d’elx, oral and intangible cultural heritage (UNESCO): Basilica de santa maria de elche, in: Proceedings of Forum Acusticum, 2014, pp. 1–6. [Google Scholar]
- B. Postma, B. Katz: Acoustics of notre-dame cathedral de paris, in: Proceedings of the International Congress on Acoustics (ICA), Buenos Aires, Argentina, 2016. [Google Scholar]
- B. Katz, E. Wetherill: Fogg art museum lecture room, a calibrated recreation of the birthplace of room acoustics, in: Proceedings of Forum Acusticum, 2005. [Google Scholar]
- S. Weinzierl, H. Rosenheinrich, J. Blickensdorff, M. Horn, A. Lindau: Die akustik der konzertsäle im leipziger gewandhaus. geschichte, rekonstruktion und auralisation, in: Proceeding of Fortschritte des Akustik, DAGA, Berlin, Germany, 2010, pp. 1045–1046. [Google Scholar]
- B. Postma, S. Dubouilh, B.F.G. Katz: An archeoacoustic study of the history of the Palais du Trocadero (1878–1937). The Journal of the Acoustical Society of America 145, 4 (2019) 2810–2821. [Google Scholar]
- S. Vissilantonopoulos, J. Mourjopoulos: Virtual acoustic reconstruction of ritual and public spaces of ancient Greece. Acta Acustica united with Acustica 87 (2001) 604–609. [Google Scholar]
- J. Takala, M. Kylliäinen: Comparison of modelled performance of a vanished building with historical information on its acoustics, in: Proceedings of Forum Acusticum, 2014, pp. 1–6. [Google Scholar]
- H. Niemi, M. Kylliäinen, J. Jäppinen, M. Lindqvist: Acoustics of vanished concert halls of helsinki: preliminary results, in: Proceedings of Forum Acusticum, 2014, pp. 1–6. [Google Scholar]
- X. Zeng, C. Christensen, J. Rindel: Practical methods to define scattering coefficients in a room acoustics computer model. Applied Acoustics 67 (2006) 771–786. [CrossRef] [Google Scholar]
- B. Postma, B.F.G. Katz: An archaeoacoustic study on shape: the case study of the iffland theatre’s history (1802–1817). Acta Acustica united with Acustica 54, 7 (2023) 1–11. [Google Scholar]
- F. Martellotta: Caveats and pitfalls in acoustic simulation of non-existing buildings, in: Proceedings of the 2nd Symposium: The Acoustics of Ancient Theatres, Verona, Italy, 2022, pp. 1–4. [Google Scholar]
- Stadtarchiv München: Feiern zum 9. November 1934 / 02, https://stadtarchiv.muenchen.de/scopeQuery/detail.aspx?ID=463286, signatur: FS-NS-00576, Bestand: NS-Pressefotografie, Fotograf: Huhle, 1934. [Google Scholar]
- Stadtarchiv München: Feiern zum 9. November 1934, bürgerbräukeller, 8. November 1934, https://stadtarchiv.muenchen.de/scopeQuery/detail.aspx?ID=463287, signatur: FS-NS-00577, Bestand: Fotosammlung NS-Zeit, 1934. [Google Scholar]
- Stadtarchiv München: Feiern zum 9. November 1938, 02, https://stadtarchiv.muenchen.de/scopeQuery/detail.aspx?ID=463535, signatur: FS-NS-01258, Bestand: NS-Pressefotografie, Fotograf: Valérien, 1938. [Google Scholar]
- Stadtarchiv München: Feiern zum 9. November 1938, bürgerbräukeller, 8. November 1938, https://stadtarchiv.muenchen.de/scopeQuery/detail.aspx?ID=463536, signatur: FS-NS-01259, Bestand: Fotosammlung NS-Zeit, 1938. [Google Scholar]
- Stadtarchiv München: Bürgerbräukeller, innenansicht großer saal, 1915, https://stadtarchiv.muenchen.de/scopeQuery/detail.aspx?ID=396908, signatur: FS-PK-STB-02625, Bestand: Postkarten – Stadtbild, 1915. [Google Scholar]
- Adolf Hitler: https://archive.org/details/19391108AdolfHitlerRedeImBuergerbraeukellerBegruessungVonChristianWeber1h00m, audio recording of a speech delivered by Adolf Hitler at the Bürgerbräukeller, Munich (November 8 1939). https://archive.org/details/19391108AdolfHitlerRedeImBuergerbraeukellerBegruessungVonChristianWeber1h00m. [Google Scholar]
- H. Haas: Über den einfluss eines einfachechos auf die hörsamkeit von sprache. Acustica 1 (1951) 49–58. [Google Scholar]
- H. Seraphim: Untersuchungen uber die unterschiedsschwelle exponentiellen abklingens von rauschbandimpulsen. [Investigations about the difference threshold in exponential decay of noise band pulses]. Acustica 5, 1 (1958) 280–284. [Google Scholar]
- E.A. Lehmann, A.M. Johansson: Diffuse reverberation model for efficient image-source simulation of room impulse responses. IEEE Transactions on Audio, Speech, and Language Processing 16, 6 (2008) 1379–1393. [Google Scholar]
- B. Postma, B. Katz: Perceptive and objective evaluation of calibrated room acoustic simulation auralizations. The Journal of the Acoustical Society of America 140 (2016) 4326–4337. [Google Scholar]
- M. Vorländer: Auralizations Fundamentals of Acoustics, Modeling, Simulation, Algorithms and Acoustic Virtual Reality. Springer-Verlag, 2008. [Google Scholar]
- www.acoustic.ua: Absorption coefficient, http://www.acoustic.ua/st/web_absorption_data_eng.pdf, accessed: 2025-25-05. [Google Scholar]
- Acoustic Supplies: https://www.acoustic-supplies.com/absorption-coefficient-chart/, accessed: 2025-25-05. [Google Scholar]
- ISO 354:2003 – acoustics – measurement of sound absorption in a reverberation room, revised version of ISO 354:1985, 2003. [Google Scholar]
- M. Barron: Auditorium Acoustics and Architectural Design. Taylor & Francis, London, 1993. [Google Scholar]
- L.L. Beranek: Concert Halls and Opera Houses: Music, Acoustics, and Architecture, 2nd edn. Springer, New York, 2004. [Google Scholar]
- B. Dalenbäck: Engineering principles and techniques in room acoustics prediction, in: Baltic-Nordic. Acoustics Meeting, 2010. http://www.catt.se/BNAM-Bergen-2010-CATT.pdf. [Google Scholar]
- T.W. Leishman, S.D. Bellows, C.M. Pincock, J.K. Whiting: High-resolution spherical directivity of live speech from a multiple-capture transfer function method. The Journal of the Acoustical Society of America 149, 3 (2021) 1507–1523. [CrossRef] [PubMed] [Google Scholar]
- International Electrotechnical Commission: Sound system equipment – Part 16: Objective rating of speech intelligibility by speech transmission index, 2020. [Google Scholar]
Cite this article as: Postma B.N.J. 2026. A room acoustic calibration method for vanished architectural spaces using archival sound: A case study of the Bürgerbräukeller (1885–1979). Acta Acustica, 10, 68. https://doi.org/10.1051/aacus/2026074.
All Tables
Absorption coefficients, chardepth (c d, mm) as the single value using equation (1), and associated surface area (m2) in the calibrated GA model. † have defined scattering coefficients of [30%,40%,50%,60%,70%,80%]. When no final absorption coefficients are depicted, they were left unchanged during the calibration.
Average and standard deviation (here defined as run-to-run variaton) from 10 simulations of the initial configuration.
All Figures
|
Figure 1. Photos from the Bürgerbräukeller. |
| In the text | |
|
Figure 2. (a) Typical Schroeder curves with T15 thresholds, illustrating the decay of amplitude over time for octave bands 250–4000 Hz and (b) Typical third-octave spectrogram for the third-octave bands 200–5000 Hz. |
| In the text | |
|
Figure 3. Boxplot showing the distribution of T15 results for the nine audience outburst (outliers omitted) across octave bands, excluding 125 Hz. |
| In the text | |
|
Figure 4. Geometric model of the Bürgerbräukeller. The figure shows top, side, and front projections (left), as well as a 3D perspective view (bottom right). Red markers indicate source positions (S0–S9), and the blue marker shows the receiver position at the historical microphone location. |
| In the text | |
|
Figure 5. Reverberation time T15 across octave bands (125 to 4000 Hz) for various configurations. The “Initial” shows the T15 for the original configuration. The minimum and maximum values reflect the modeled acoustic extremes for absorption. The “10% scattering” and “99% scattering” lines show the T15 results for the initial model with the scattering set to these values. “Measurement” refers to the measured values, with +/−0.1 s envelopes indicating uncertainty bounds. |
| In the text | |
|
Figure 6. Simulation results for speech intelligibility (STI) in the assumed 1923 configuration of the Bürgerbräukeller. |
| In the text | |
Current usage metrics show cumulative count of Article Views (full-text article views including HTML views, PDF and ePub downloads, according to the available data) and Abstracts Views on Vision4Press platform.
Data correspond to usage on the plateform after 2015. The current usage metrics is available 48-96 hours after online publication and is updated daily on week days.
Initial download of the metrics may take a while.