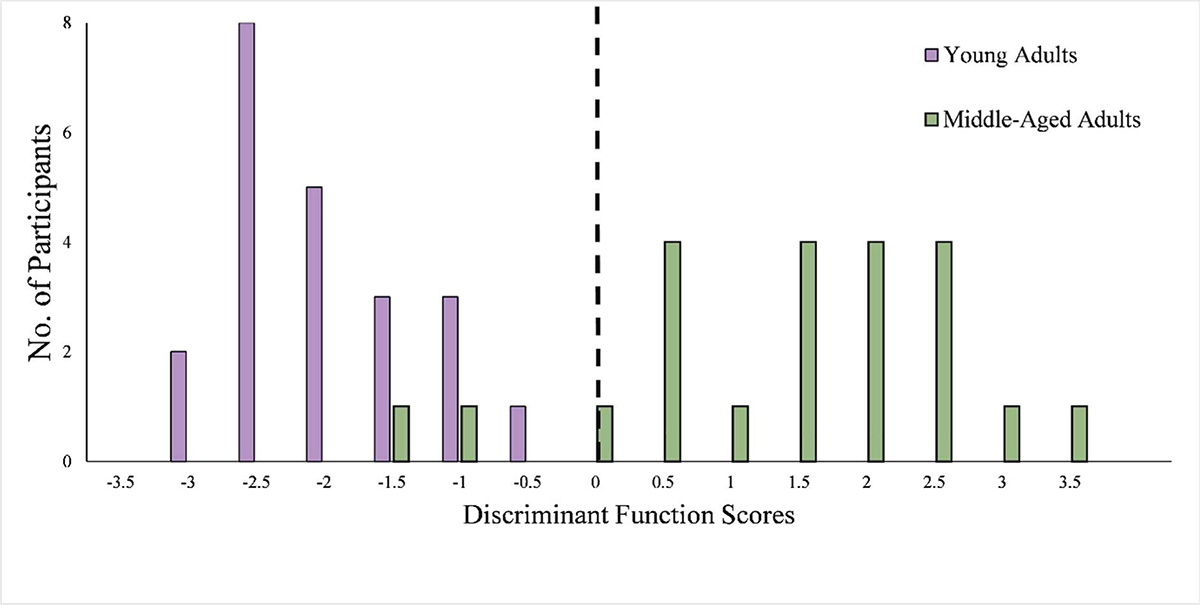
Figure 10.
Download original image
Bar graphs representing the discriminant function scores for the segregation of both the groups. The dotted line is the reference for cut-off scores between the groups on the discriminant function.
Current usage metrics show cumulative count of Article Views (full-text article views including HTML views, PDF and ePub downloads, according to the available data) and Abstracts Views on Vision4Press platform.
Data correspond to usage on the plateform after 2015. The current usage metrics is available 48-96 hours after online publication and is updated daily on week days.
Initial download of the metrics may take a while.