| Issue |
Acta Acust.
Volume 10, 2026
Topical Issue - Spatial and binaural hearing: From neural processes to applications
|
|
|---|---|---|
| Article Number | 19 | |
| Number of page(s) | 14 | |
| DOI | https://doi.org/10.1051/aacus/2026015 | |
| Published online | 30 March 2026 | |
Scientific Article
Early detection of age-related spatial processing decline: A cross-sectional analysis of four auditory measures
Department of Audiology, All India Institute of Speech and Hearing, A recognized Research Centre of University of Mysore, Mysore 570006, India
* Corresponding author: This email address is being protected from spambots. You need JavaScript enabled to view it.
Received:
10
June
2025
Accepted:
9
February
2026
Abstract
Auditory spatial discrimination measures, including interaural time difference (ITD), interaural level difference (ILD), minimum audible angle (MAA) and bisection accuracy (BA), are key components of spatial auditory processing and contribute to accurate sound localization. Age-related declines in these abilities can negatively impact spatial awareness and daily communication. The study investigated the sensitivity of four spatial hearing measures – ITD, ILD, MAA and BA to age-related changes in auditory spatial discrimination. An experimental cross-sectional study design was adopted, with purposive sampling of 44 clinically normal-hearing participants (22 young and 22 middle-aged adults). Spatialized white noise bursts were generated by convolving signals with non-individualized head-related transfer functions using the 3D Tune-In Toolkit, a software environment for simulating 3D audio over headphones. ITD and ILD tasks involved detecting time and intensity differences between ears. MAA assessed the smallest discriminable angle. BA measured the ability to bisect auditory space into two hemifields. MANOVA revealed significant main effect of age across all measures (p < 0.001), with middle-aged adults showing significantly poorer spatial discrimination. Receiver Operating Characteristic analyses identified MAA as the most sensitive measure. Fisher’s Discriminant analysis further validated the discriminatory power of MAA for group categorization. These findings suggest that auditory spatial discrimination abilities may begin to show subtle changes at mid-adulthood. The MAA shows to be a promising marker out of the four measures for detecting early spatial processing deficits.
Key words: Auditory / Spatial discrimination / Virtual / Interaural time and level difference / Minimum audible angle / Bisection accuracy / Aging
© The Author(s), Published by EDP Sciences, 2026
 This is an Open Access article distributed under the terms of the Creative Commons Attribution License (https://creativecommons.org/licenses/by/4.0), which permits unrestricted use, distribution, and reproduction in any medium, provided the original work is properly cited.
1 Introduction
In daily life, distinguishing between different sound sources supports communication, attention, and safety. While sound discrimination encompasses multiple aspects like frequency, amplitude, and temporal patterns, spatial sound discrimination focuses explicitly on the ability to locate and distinguish sound sources in three-dimensional space [1]. This construct can be broken down to several key facets: lateralization, which refers to the perception of a sound’s left-right position primarily through interaural time differences and level differences (ITDs and ILDs) [2–4], localization precision using minimum audible angle (MAA) [5–9], and spatial mapping which involves perceiving and organizing sounds within a broader spatial framework, typically evaluated via bisection threshold [10, 11]. Like any other sensory and cognitive function, age-related changes can alter spatial hearing abilities. Declines in spatial processing have been linked to difficulties with navigation, object recognition, and everyday task completion [12, 13]. Recent research has reported a decline in binaural hearing pertaining to temporal and spatial processing abilities with advancing age. Studies have shown that older adults exhibit reduced sensitivity to temporal fine structure and modulation cues, indicating a decline in neural timing precision [14–17]. Evidence from electrophysiological and behavioral measures further suggests age-related degradation in binaural temporal processing, affecting the encoding of interaural time and level differences [18–21]. Consequently, older listeners demonstrate reduced spatial release from masking and poorer lateralization performance [22–25], underscoring the combined influence of peripheral and central auditory declines on spatial hearing in aging. Gallun and Best [26] have linked reduced sensitivity to interaural cues, impaired neural encoding of spatial information, and cognitive decline in spatial release from masking, attention and working memory. Early detection of these deficits is important to allow for interventions to help maintain independence and quality of life as individuals age.
In the context of spatial discrimination, each task tests different cues that contribute to spatial hearing. ITD measures assess the listener’s ability to detect microsecond-level temporal disparities between ears. On the other hand, ILD measurements quantify sensitivity to interaural intensity variations measured in decibels. Although ITD and ILD thresholds are typically done for pure tones [27–29] or narrow-band noises [3], respectively, few studies have measured these binaural differential thresholds using white noise [30, 31]. The normative ITD and ILD ranges between 0.01 to 0.05 milliseconds (ms) [27–29] and between 0.5 dB and 2.5 dB for pure tones [32], respectively. Thavam and Dietz [3] found thresholds of 0.01 and 0.0107 milliseconds for 600–1000 Hz noise and 20–1400 Hz noise, respectively. Limited spectra cues in narrower bandwidths and temporal smearing in wider bandwidths yielded higher thresholds. ILD thresholds of 0.5–4 dB were obtained, when Gaussian noise was used [33]. Nisha et al. [30] reported that ITD thresholds from 0.01 to 0.06 ms and 0.03 to 1.2 ms for young adults (21–40 years) and middle-aged adults (41–60 years) for white noise bursts. In the same study, the ILD thresholds ranged from 0.5 to 2 dB and 0.8 to 3 dB in young and middle-aged adults, respectively.
The MAA measures the minimum angular separation required for discriminating between two sound source positions in the azimuthal plane [5]. MAA was found to be as close to 1° for a broadband click stimulus presented using an array of 13 loudspeakers [34]. Agguis-Vella et al. [11] reported MAA ranged from 3° to 15° using 100 ms long white noise bursts at a level of 65 dB SPL in an 11 loudspeaker setup in normal hearing young adults (mean age: 38.5 years, SD: 8.4 years). Vector-based amplitude panning yielded an average MAA of 1.1° with Gaussian noise in adults aged 22 to 29 years [9]. Under headphones, MAA for a 100 ms long band pass noise (300–1200 Hz), mean thresholds were 9.7° with a deviation of 8.3° for adults aged 18–25 years [6]. With aging, individuals experience subtle declines in auditory processing that may affect their ability to detect small angular differences between sound sources [35]. Freigang et al. [36] measured MAA in the free-field using low- (0.375–0.75 kHz) and high-frequency (2.25–4.5 kHz) noise bands in young adults aged 20–29 years and older adults aged 65–83 years. The MAA thresholds ranged from 2° to 5° for the central position. They reported advancing age to affect the mean MAA’s in young adults to mean ∼4.5° in young adults to ∼12.5° in older adults.
The auditory bisection test, a contemporary addition to spatial discrimination assessment protocols where participants identify the perceived midpoint or boundaries between two or more sound sources to gauge spatial acuity [37]. Using an auditory bisection task, Agguis-Vella et al. [11] assessed normal hearing listeners’ abilities (mean age: 38.5 years, SD: 8.4 years) to partition the horizontal plane into left and right hemifields. This study showed that the bisection threshold lies between 1°–12°. Another study measured the bisection threshold in free-field (11°–14°) and closed-field (11°–33°) [10]. A variant of bisection thresholds is the bisection accuracy score, which is conceptualised in the current study. Bisection accuracy (BA) calculates discrimination scores instead of arriving at the threshold and can be operationally defined as the ability to determine the relative position of a target sound in relation to two fixed reference points. It can also serve as a complementing measure of auditory discrimination with less testing time, with outcome scores reflecting real world spatial processing demands. In this task, reference sounds are presented at distinct spatial locations (90° towards left, and 90° towards right), interleaved with a target sound (which can be closer to right or left reference sounds). The listener’s task is to judge whether the target sound’s position is spatially closer to the left or right reference point. This measure provides valuable insights into the ability to mentally partition auditory space [38, 39]. BA may have particular relevance for clinical populations such as individuals with hemispatial neglect [40]. BA assesses relational judgments in auditory fields, whereas MAA tracks fine-grained discriminability.
While various measures exist to assess spatial discrimination, there is limited understanding of which measure best predicts age-related changes in spatial hearing abilities. Age-related reductions in temporal fine-structure sensitivity and neural synchrony are expected to degrade ITD processing, while high-frequency hearing loss may further affect ILD sensitivity [41–43], providing a mechanistic rationale for the present spatial discrimination focus. Together, all four tasks offer a progression from basic binaural cue sensitivity (ITD/ILD) to perceptual discrimination (MAA) and spatial mapping (BA), enabling a multidimensional assessment of spatial hearing. By comparing these measures, the research seeks to: (1) identify behavioural indicators of spatial hearing decline across age, (2) determine which measure offers the most predictive power, and (3) identify the most efficient diagnostic tool for early detection of spatial hearing deficits specific to auditory spatial discrimination.
2 Methods
2.1 Research design
An experimental cross-sectional research design [44] with two age groups: young adults and middle-aged adults was employed. All participants were recruited using purposive sampling.
2.2 Participants
44 participants with clinically normal-hearing individuals with pure tone average (PTA) of < 15 dB HL at 0.5, 1, 2, and 4 kHz were divided into two age groups: 22 young adults (12 females and 10 males) aged 18 to 40 years (Mean: 26.15; SD: 2.96) and 22 middle-aged adults (9 females and 13 males) aged 41–60 years (Mean: 49.00; SD: 6.51).
Audiometric air conduction thresholds were measured for each participant at frequencies 0.25k Hz, 0.5k Hz, 1k Hz, 2k Hz and 4k Hz. The interaural difference in thresholds was generally less than or equal to 10 dB HL at all frequencies tested. Figure 1 depicts individual frequency specific interaural differences. Audiometric PTA values ranged from 2.5–11.25 dB HL (left ear) and 2.5–10 dB HL (right ear). The interaural PTA difference ranged from 0 to 6.25 dB HL (mean: 1.96 dB, SD: 0.48 dB). All participants were screened for auditory processing on the Screening Checklist for Auditory Processing in Adults (SCAP-A) [45], followed by the Neuropsychological Evaluation Screening Tool (NEST) for cognitive deficits [46]. Participants who scored < 3 on SCAP-A and ≤2 on NEST respectively, were included in the study. These cut off scores revealed normal auditory processing and no cognitive deficits. Participants were recruited from our institute. Individuals with middle ear disorders, sensorineural hearing loss, neurological conditions and cognitive deficits were excluded from the study. Individuals with more than five years of formal musical training [47, 48] were excluded and no further stratification was performed.
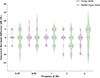 |
Figure 1. Left–right threshold differences (dB) across frequencies (0.25–4k Hz) in young and middle-aged adults. Each box shows the mean, SD, and individual data points, with zero representing perfect interaural symmetry. While middle-aged adults (green) exhibit slightly greater variability, group differences in interaural threshold asymmetry were not statistically significant. |
2.3 Sample size calculation
To determine the sample size for the study, G*Power software (version 3.1) [49] was used to ensure sufficient statistical power for understanding the effect of age on four measures- ITD, ILD, MAA and BA. A pilot study with 20 participants (10 in each group) provided estimates of effect size variability for the measures. Based on the pilot data, the type I (α) and type II (β) were set at 0.05 and 0.8, respectively, to achieve a statistical power of 0.80. Using these parameters, the required sample size for detecting significant group differences across the four measures was estimated to be 22 participants in each group. These 20 participants from the pilot study were retained and included in the final analysis.
2.3.1 Informed consent and ethical approval
This study was conducted in accordance with the ethical principles outlined in the Declaration of Helsinki [50]. Ethical committee approval was obtained from the institutional review board (no. SH/IRB/M.1-20-2024-25), and all the participants gave written informed consent before their inclusion in the study. Participation in the study was voluntary, and no financial compensation was provided. The spatial discrimination measures used in the study were ITD, ILD, MAA and BA.
2.3.2 Instrumentation
The stimuli for all the tests were routed through MOTU-MICROBOOK IIc audio interface connected to a personal laptop (Dell G15, 12th Gen Intel (R) Core (TM) i5-12500H, 2.50 GHz with 16 GB RAM with Windows 11). Stimuli were presented through circumaural headphones (Sennheiser HD 569 PRO, Wedemark, Germany). The presentation level was maintained at 65 dB SPL. All the test stimuli were calibrated using a dual channel sound-level meter (Bruel & Kjaer model 2270: HBK Company) based on recordings obtained from the IEC 60711 ear-simulator from the Knowles Electronics Manikin for Acoustic Research (KEMAR) manikin (GRAS, Denmark). Prior to each test, headphones were fitted by the experimenter to ensure consistent positioning, and participants maintained a stable head position during testing.
2.3.3 Tests administered and procedure
2.3.4 Interaural Time and Level Differences (ITD and ILD)
ITD and ILD thresholds were evaluated in both groups using a customized Matlab code that runs on MATLAB Version 2024a. The code was adapted from the Psychoacoustic Toolbox [51]. A three interval three alternative force choice method (3I-3AFC) was used as shown in Figure 2D, wherein each trial had a target and two reference stimuli. Both target and reference stimuli consisted of 250 ms white noise bursts (WN) (with 5 ms rise and fall time) calibrated to the level of 65 dB SPL. The WN were chosen as they provide acoustic cues at all frequencies that are essential for binaural spatial perception.
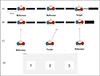 |
Figure 2. (A), (B) and (C) show the schematic representation of ITD, ILD and MAA tasks, respectively. (D) GUI used for ITD, ILD and MAA tasks. |
The MATLAB code generates reference tone and the target stimuli in real-time. The reference tone comprised of WN bursts which produced a midline sensation, owing to its equal intensity and time of arrival in both ears. The variable stimuli were similar to reference stimuli but were presented with time delay (initial delay: 0.68 ms) delay in the left ear, adaptively reducing/increasing by a factor of 2) and intensity variations (initial level difference: 20 dB in the left ear, 1 dB step size) for ITD and ILD threshold estimation, respectively. These differences in time and level are given to the left and right ear respectively, so that the stimuli lateralize invariably to the right ear [30]. A two-down, one-up transformed staircase method converging at 70.7% of the psychometric function [52]. The participant’s task was to indicate the target sound by selecting the appropriate interval used in the graphical user interface (GUI) shown in Figures 2A and 2B. Each participant underwent a familiarization phase of 4 reversals for both tasks before the test. Following familiarization, the test phase was terminated after the completion of ten reversals, from which the last four reversals were averaged to obtain the ITD and ILD thresholds.
2.3.5 Minimum Audible Angle (MAA)
To measure MAA, stimuli (250 ms WN bursts levelled at 65 dB SPL) were simulated using the 3D Tune-In Toolkit (3DTI), an open-source library for three-dimensional soundscapes that can be delivered with headphones [53]. The software generates spatially simulated signals through a direct convolution technique utilizing a head-related transfer function (HRTF) and a monoaural sound signal. The Default HRTFs, specifically the 3DTI_HRTF_D2_256s_44100Hz dataset (SOFA file) were maintained while generating the stimuli. This dataset features impulse responses with a sample length of 256 samples and a sampling rate of 44.1 kHz, ensuring accurate spatial audio rendering for binaural simulations. Specifically, we used the default “Listen_1002” head model, corresponding to an adult listener, with an azimuth grid ranging from −0° to +359.9° in 0.01° steps (horizontal plane). The same HRTF set was applied to all participants to maintain consistency across trials, and no pinna randomization was implemented. The source control panel allows the user to adjust the selected sound source’s position (azimuth, elevation and range) and volume. The position can be expressed in Cartesian Coordinates (absolute) for e.g. 45° azimuth or spherical coordinates (relative) for e.g. x = 0.707 m, y = 0.707 m, z = 0 m. The source layout chart represents the sources’ position relative to that of the listener. Figure 3 shows the interface of 3DTI with different source positions that were used for assessing MAA and BA. All the stimuli were recorded and stored offline.
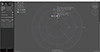 |
Figure 3. Interface of 3DTI. |
The target stimuli varied in azimuthal orientation. The WN was first generated using Adobe Audition. This mono-channel signal was loaded to 3DTI. Azimuthal separations were set for 12 angles (1°, 2°, 3°, 5°, 10°, 15°, 20°, 25°, 30°, 35°, 40°, 45°) maintaining elevation of 00 and a range of 1 m. These angles were selected to provide higher resolution at smaller separations, where threshold estimates are most sensitive, and to ensure broad coverage across the spatial range. Stimuli were recorded for the right hemifield and stored offline. A custom Matlab code was designed to present the reference stimulus twice and the deviant stimulus once using a 3I-3AFC method. The stimulus was adjusted adaptively using a two-down one-up transformed staircase approach [52]. The initial separation was set at 45°, and the step sizes were chosen to provide finer resolution at lower angles. Specifically, smaller steps (1°–5°) were used at the beginning of the staircase, where thresholds were expected to be lowest, based on reports of minimum audible angle (MAA) as small as 3° under headphone presentation in prior studies [6]. For separations above 5°, step sizes increased in 5° increments to maintain efficiency in threshold estimation at wider angles. While this approach deviates from the traditional assumption of symmetrical step sizes in adaptive methods, it was adopted to optimize sensitivity near expected thresholds while limiting test duration. The test was terminated after 10 reversals and the last four reversals were averaged to compute the MAA threshold.
2.3.6 Bisection accuracy (BA)
To assess BA, stimuli were spatially simulated similar to the stimuli using 3DTI software as done for MAA. The task required the participants to listen a sound sequence comprising three 250 ms long spatial sounds (two references with an embedded target) spaced at an interval of 500 ms. The reference sounds in the first and third intervals were spatialized to 90° azimuths towards the left and right, respectively. These were interleaved with a target sound presented at varying angles (15°, 30°, 45°, and 60°) to the left or right hemifields in the second interval (8 target locations: L15°, L30°, L45°, L60°, R15°, R30°, R45° and R60°). Participants were instructed to judge whether the target sound was closer to the left or right reference sound.
The familiarization phase included (1) Stimulus familiarization and (2) Task familiarization. The GUI designed for these tasks is shown in Figures 4 and 5, respectively (Note: The same interface was used for task familiarization and Test phase). The user could click on each labelled box, which would correspond to reference and target stimuli for having a mental image of the stimuli. Task familiarization involved five trials with feedback. The whole of the familiarization phase was not scored. The test phase consisted of 80 trials (10 trials* 8 target locations) without feedback. Each correct response was scored as 1 and 0 otherwise. All responses on the test phase were recorded, and BA was calculated by determining the percentage of correct judgments made by participants for each target angle. The accuracy scores of the right hemifield were only considered for analysis.
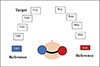 |
Figure 4. Schematic representation of VABT task. |
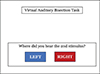 |
Figure 5. GUI used for Stimulus Familiarization (left panel), both the task familiarization and the test phase (right panel). |
2.3.7 Statistical analyses
The data were subjected to statistical analysis using IBM Statistical Package for the Social Sciences (SPSS) version 25 software (IBM Corp., Armonk, NY, USA). Shapiro-Wilk’s test of normality and descriptive statistics was performed. A paired t-test was administered to assess the interaural PTA differences within each group. An independent t-test was conducted to assess group differences in interaural frequency-specific threshold differences. A multivariate analysis of variance (MANOVA) was first conducted to examine the overall effect of age group across the four spatial hearing tasks (ITD, ILD, MAA, BA). PTA, interaural PTA differences and interaural frequency-specific threshold differences (0.25k Hz, 0.5k Hz, 1k Hz, 2k Hz and 4k Hz) were entered as covariates. Test–retest reliability was assessed in a subset of 10% of participants who were re-tested post one week of initial baseline assessment using Intraclass correlation coefficients (ICC).
Further, Receiver Operating Characteristic (ROC) analyses were done using MedCalc Statistical Software version 22.003 (MedCalc Software Ltd., Ostend, Belgium). ROC curves were used to assess the diagnostic efficiency of each measure, with area under curve (AUC) values and Youden’s index for determining the most sensitive measure for detecting age-related changes. Psychometric curve fitting and d prime (d′) analysis were performed to quantify bisection accuracy. Further, Fisher discriminant function analysis (FDA) was carried out using the combined spatial discrimination data. A default mathematical operation (Di = a b1x1 + b2x2 + … + bnxn; Di = predicted discriminant score; a = a constant, x = predictor; b = discriminant coefficient) for group categorization was employed in the study. This aimed to determine which measure(s) best predict age-related changes using SPSS. Leave-one-out cross-validation was applied to assess the stability of the group membership from. Additionally, a binary logistic regression analysis was carried out as secondary validation approach to confirm the discriminative power of the spatial discrimination measures.
3 Results
Shapiro Wilk’s test confirmed that the data were normally distributed (p > 0.05) for each group. The descriptive statistics, including mean and 95% Confidence intervals for both groups, are depicted in Figure 6. Paired t-test results comparing interaural PTA differences in young adults [t(21)=2.017, p = 0.06, Cohen’s d: 0.36, 95% CI: −1.27 to 0.13] and middle-aged adults [t(21)= − 0.813, p = 0.43, Cohen’s d: 0.35, 95% CI: −1.69 to 0.19] were not statistically different, confirming that both groups had generally symmetrical hearing. Independent t-test results also further revealed that the groups did not differ significantly in PTA [t(42)= − 1.92, p = 0.06, Cohen’s d: 0.58, 95% CI: −1.79 to 0.04]; interaural PTA difference [t(42)= − 1.32, p = 0.19, Cohen’s d: 0.4, 95% CI: −1.26 to 0.26]; and interaural frequency specific differences at 0.25k Hz [t(42)=0.80, p = 0.43, Cohen’s d: 0.24, 95% CI: −1.37 to 3.19], 0.5k Hz [t(42)=0.40, p = 0.691, Cohen’s d: 0.12, 95% CI: −1.83 to 2.74], 1k Hz [t(42)= − 1.82, p = 0.076, Cohen’s d: 0.55, 95% CI: −3.83 to 0.19]; 2k Hz [t(42)= − 1.78, p = 0.082, Cohen’s d: 0.39, 95% CI: −1.04 to 4.68]; 4k Hz [t(42)= − 1.742, p = 0.089, Cohen’s d: 0.53, 95% CI: −5.88 to 0.43].
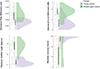 |
Figure 6. Raincloud plots illustrating group-wise distributions of spatial discrimination measures in young (green) and middle-aged (purple) adults. Each raincloud combines raw data points (left), boxplots (center), and half-violin density plots (right), visualizing both individual variability and overall distribution shape. Panel A: Interaural Time Difference (ITD) thresholds (ms);Panel B: Interaural Level Difference (ILD) thresholds (dB);Panel C: Minimum Audible Angle (MAA) thresholds (degrees);Panel D: Bisection Accuracy (BA) scores. |
3.1 Effect of age on different measures of spatial discrimination
Box’s M test revealed a significant difference in covariance matrices across groups, Box’s M = 57.99, [F(10, 8433.47)=5.2, p < 0.001], indicating a violation of the homogeneity of covariance assumption. Therefore, Pillai’s Trace was used for interpretation of multivariate effects. MANOVA revealed a significant multivariate effect of age group on overall spatial discrimination performance, Pillai’s trace =0.754, [F(4, 39)=24.39, p < 0.001, η p 2 = 0.75], indicating age-related differences across tasks depicted in Table 1. Young adults showed lower thresholds on ITD, ILD and MAA and high BA than middle aged adults as shown in Figure 6. PTA, interaural differences in PTA, and frequency-specific differences as covariates. None of these covariates reached significance for any spatial measure, indicating that audiometric factors did not contribute meaningfully to performance; critically, the main effect of group remained robust across MAA, ITD, ILD, and BA (Appendix A). Test-retest reliability demonstrated good to excellent reliability for all measures: MAA (ICC = 0.82), ITD (ICC = 0.88), ILD (ICC = 0.79), and BA (ICC = 0.90).
Summary of multivariate analysis of variance (MANOVA) results comparing spatial auditory discrimination measures across age groups. The table represents the F-values, Bonferroni corrected significance levels (p), and partial eta-squared (η p 2 ) effect sizes for interaural time differences (ITD), interaural level differences (ILD), minimum audible angle (MAA) and bisection accuracy (BA).
3.2 Diagnostic efficiency of each measure of auditory spatial discrimination
Since all 4 spatial discrimination measures were susceptible to age-related deterioration in hearing, an attempt was made to understand the sensitivity of these measures for age-related changes in spatial hearing using ROC analysis. The results indicated that MAA had the highest diagnostic accuracy with an AUC of 0.99, followed by ITD with an AUC of 0.88, ILD with an AUC of 0.87 and BA with an AUC of 0.82 as depicted in Figure 7. Table 2 shows the sensitivity, specificity, AUC with Standard Error (SE) and the optimal cutoff for each variable based on Youden’s index. MAA, with 100% specificity and 90.91% accuracy, emerged as the most sensitive measure for detecting early age-related changes in spatial discrimination abilities. MAA also had a maximum AUC (0.99), with the smallest standard error (0.01) and the highest Youden’s Index (0.91), indicating the best overall discriminatory ability of the measure for spatial changes with age. The cut-off value for MAA was > 9.08, indicating that participants with MAA lower than 9.08° were usually younger, and those above were in the middle-aged group. Also, all measures show good specificity (> 90%), and reasonable sensitivity. Internal validation was performed using both 5-fold cross-validation and 0.632 bootstrap resampling. For cross-validation, four folds were used for training and the remaining fold for testing in each iteration, ensuring that every participant served once in the test set. The mean AUC across folds was computed to estimate out-of-sample performance, and optimism was calculated as the difference between the apparent and cross-validated AUCs. The cross-validated mean AUC was 0.978 (95% CI: 0.953–1.000), indicating minimal optimism.
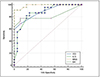 |
Figure 7. Comparison of ROC curves for each of the auditory spatial discrimination measures. The x-axis shows false positive rate (1-specificity), and the y-axis shows true positive rate (sensitivity). Higher area under curve values indicates better discrimination. |
Receiver Operating Characteristic (ROC) Analyses for spatial auditory spatial discrimination measures, including interaural time differences (ITD), interaural level differences (ILD), minimum audible angle (MAA) and bisection accuracy (BA). The table reports sensitivity, specificity, area under the curve (AUC) with standard error (SE), Youden’s Index, optimal cut-off values for distinguishing between young and middle-aged adults. Higher AUC vales indicate greater diagnostic accuracy.
On psychometric curve fitting, a sharp transition between L15° and R15° was observed. This reflects a well-defined lateralization boundary and high spatial acuity in young adults. In contrast, middle-aged adults showed a noticeably shallower slope and greater response variability near midline, indicating reduced precision in frontal discrimination, as shown in Figure 8. The d′ values were computed for left–right pairs at four angular separations (15°, 30°, 45°, and 60°). Across all separations, young adults exhibited markedly higher d′ values than middle-aged adults, indicating superior left–right discriminability as shown in Figure 9. Young adults showed relatively narrow d′ ranges across angular separations (15°: 1.54; 30°: 1.19; 45°: 0.59; 60°: 0.59), reflecting consistent performance with minima between 1.84 and 2.79 and maxima clustering at 3.38. In contrast, middle-aged adults exhibited substantially wider and uniform ranges at all angles (2.44 for 15°, 30°, 45°, and 60°), with values spanning from 0.95 to 3.38, indicating greater variability and less reliable spatial discriminability [54].
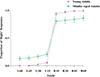 |
Figure 8. Proportion of “Right” responses on bisection accuracy task across azimuths for young and middle-aged adults. Symbols indicate mean values and error bars represent ±1 standard deviation both in percentage units. Both groups showed low “Right” response rates for leftward sources and increasing probabilities with rightward azimuths. |
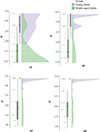 |
Figure 9. Group-wise comparison of sensitivity index (d′) across spatial separations (15°, 30°, 45°, 60°) from bisection accuracy task. Raincloud plots show the distribution and mean of d′ values for young adults (purple) and middle-aged adults (green). Shaded regions represent kernel density estimates, with boxplots. |
3.3 Determining the clinical marker for predicting age-related changes in auditory spatial discrimination
On Fisher discriminant factor analysis (FDA), Wilks’ Lambda was statistically significant [λ = 0.25, χ2(4)=56.02, p < 0.001] and yielded a single canonical discriminant function (DF). This indicates that the discriminant function 1 could significantly differentiate between the groups based on the variables. The standardized canonical discriminant function equation is:

MAA showed the strongest discriminative contribution (coefficient = 0.99), reflecting its high predictive sensitivity to age-related differences in auditory spatial discrimination. ITD and ILD contributed comparably (coefficients = 0.49 and 0.48, respectively), while BA exhibited a smaller and negative contribution ( − 0.49), indicating lower discriminative weight. The discriminant scores were computed for each participant and plotted (Fig. 10), showing clear separation between young and middle-aged adults. The dotted vertical line in Figure 10 represents the discriminant boundary between the two groups. Leave-one-out cross-validation yielded an identical accuracy of 95.5%, confirming strong model stability and negligible overfitting, with 100% of young and 90.9% of middle-aged participants correctly classified as shown in Table 3.
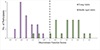 |
Figure 10. Bar graphs representing the discriminant function scores for the segregation of both the groups. The dotted line is the reference for cut-off scores between the groups on the discriminant function. |
Cross validated accuracy of discriminant function analyses comparing predicted group membership. Total participants (number count) are tabulated with the corresponding percentage in parentheses.
To validate this finding, binary logistic regression was conducted. The model included BA, ITD, ILD, and MAA (all standardized) as predictors. The overall model fit [χ 2(8)=1.58, p = 0.991] and classification accuracy (93.2%) matched the discriminant analysis results. Among predictors, only MAA contributed significantly (Wald = 4.06, p = 0.044), indicated that the predictors collectively contributed to classification accuracy. MAA was the only significant variable (B = −9.65, SE = 4.79, Wald = 4.06, p = 0.044), indicating that poorer MAA performance was associated with lower odds of being classified into young adults’ group {Exp(B)=0.000, 95% CI[0.000, 0.765]}. The effects of BA (B = 0.06, p = 0.978), ITD (B = 1.14, p = 0.642), and ILD (B = 1.48, p = 0.313) were not significant predictors of group membership.
4 Discussion
The present study demonstrated significant age-related differences in auditory spatial discrimination scores across various measures, including ITD, ILD MAA and BA. Younger adults consistently exhibited superior performance with lower ITD, ILD and MAA thresholds and higher BA than middle-aged adults (Fig. 6). The MANOVA results confirmed the multivariate effect of age, with all measures showing significant differences between groups (Tab. 1). Nisha et al. [30] reported a similar trend in the ITD and ILD using a similar methodology to the current study. ITD ranged from 0.01 to 0.06 ms and 0.03 to 1.2 ms, whereas ILD ranged from 0.5 to 2 dB and 0.8 to 3 dB in young (21–40 years) and middle-aged (41–60 years) adults, respectively. Although all participants had clinically normal audiometric thresholds, emerging evidence suggests that subtle binaural processing deficits may be associated with even minor deviations in hearing sensitivity. Bernstein and Trahiotis [55] for example, reported binaural deficits in listeners with thresholds worse than 7.5 dB HL. In the current study, we used white noise bursts in quiet to measure ITD sensitivity, a condition in which this 7.5 dB threshold effect may not manifest in the same way. Nevertheless, the measures were not affected by PTA, interaural PTA differences and interaural frequency-specific threshold differences (Appendix A). Freigang et al. [36] found that MAA ranged from 0 to 10° in young adults (mean age: 24.1 years), whereas it ranged from 20 to 30° in older adults (mean age: 68.1 years). The current study presents a novel finding that middle-aged adults, too, demonstrate elevated MAAs. BA is a measure that has not been previously explored, and there isn’t research done in the context of bisection thresholds trend ageing. Young adults showed near-ideal categorical performance, whereas middle aged adults presented with ambiguity around the midline. This suggests that younger listeners encode and utilize spatial cues with high precision, enabling accurate detection of small left–right deviations in frontal positions (Fig. 9). In contrast, middle-aged adults showed a more gradual response shift, consistent with reduced sensitivity and broader spatial perceptual boundaries. The existing literature on spatial acuity studies report that accuracy starts to decline in the 4th decade of life [30, 56]. It can be hypothesized that auditory spatial discrimination, too, may be decline.
MAA was found to be a sensitive measure for detecting age-related spatial hearing changes, as confirmed by the FDA (Tab. 2). ITD and ILD had similar but lower weights, reflecting their roles in temporal and intensity-based localization cues, which also degrade with age but may be less predictive in differentiating middle-aged listeners. BA followed an opposite trend as compared to other measures suggesting a decline in accuracy in the middle-aged adult group. On evaluating the diagnostic efficiency of all four measures using ROC analysis, MAA emerged again as the most effective in differentiating between age groups, achieving an AUC of 0.978. Additionally, all measures demonstrate good specificity, suggesting low false positive rates, which indicates the prevention of over-referral (Tab. 3 and Fig. 7).
From both analyses (FDA, ROC), MAA is the most sensitive measure to detect an age-related change in auditory spatial discrimination abilities. It can be stated that ITD and ILD tasks primarily assess lateralization cues, whereas MAA focuses on spatial resolution, making it more comprehensive for evaluating spatial discrimination. On the other hand, BA tasks, which involve determining whether a sound originates from the left or right, are relatively straightforward and may lack the nuanced resolution to capture subtle discrimination differences assessing more gross manner of discrimination (Fig. 8). Notably, not all middle-aged adults showed d′ values below 1, indicating that many performed the BA task at levels comparable to young adults (Fig. 8). This further suggests that BA is a relatively low-demand task and may not be as sensitive as ITD, ILD, or MAA in capturing subtle declines in spatial hearing. The FDA classification results revealed that 95.5% of cases were correctly classified, with all young adults accurately identified, while two middle-aged adults were misclassified as younger participants. This classification error indicates a 9.1% misclassification rate for the middle-aged group. The higher correct classification rate for young adults suggests that spatial hearing abilities in younger listeners are more robust and distinct, whereas middle-aged individuals exhibit greater variability, potentially due to subtle individual differences in spatial processing decline.
The findings reinforce the utility of MAA as the most sensitive and reliable measure, highlighting its diagnostic efficiency and potential as a clinical tool for early detection of age-related spatial hearing deficits specific to discrimination. In both clinical and research contexts, spatial discrimination deficits can be assessed using MAA and the reported cut-offs may help to classify the healthy being of the process. It can serve as a useful outcome measure for evaluating outcomes of rehabilitation. The findings of the study can serve as comparative data for micro-profiling spatial deficits in disorders such as auditory neuropathy, sensorineural hearing loss, central auditory processing disorders. As this evidence derives from a cross-sectional comparison, longitudinal evidence is needed to confirm whether these reflect the onset of age-related decline. MAA emerges as a superior measure for differentiating age-related spatial hearing changes specific to discrimination tasks, demonstrating robust performance in discriminant function analysis (DFA) and ROC analysis. These findings provide a foundation for designing effective spatial test battery for early identification and interventions of spatial deficits. It is also important to acknowledge that differences in task difficulty across conditions may have contributed to the observed age effects. While participants subjectively reported ITD, ILD, and MAA tasks as more challenging than BA on informal feedback. This variability can modulate apparent age effects, emphasizing the need to interpret group differences within the context of task-specific cognitive and perceptual load [57]. Age-related disparities can also be magnified when fixed task parameters (e.g., angle step sizes or response options) are not equated for perceptual challenge across individuals. Our study incorporated changing step sizes for the MAA task (1–5° initially, followed by 5° blocks) to converge to the threshold quickly. Upon inspection of the raw data, we observed that the uptrend and downtrend step sizes were balanced in most cases, particularly those with ∼5° threshold. Future studies should therefore should incorporate standardized and computationally efficient adaptive methods such as PSI or QUEST to confirm the current measurement and for improved precision. Individualized step sizes, or threshold-tracking designs that converge on a common performance level should be incorporated which would allow clearer dissociation of peripheral encoding limitations from higher-level spatial processing differences associated with aging. Having known the utility of MAA, another methodological consideration concerns the use of non-individualized HRTFs in the closed-field condition. Because generic HRTFs do not capture individual pinna and head-related spectral features, they may not fully reflect spatial discrimination performance observed in free-field settings. [58–60] Such mismatches can attenuate or distort cues critical for vertical and front–back localization, potentially influencing measured MAA/BA sensitivity. Individualized or anthropometrically matched HRTFs would be a valuable and justified choice for conducting spatial hearing tasks. Replicating these findings in free-field environments and finer, decade-based age groups would allow a more detailed characterization of age-related changes in spatial discrimination. The cutoff values derived in the present study were obtained empirically from the same dataset and have not yet been clinically validated. As such, these thresholds should be considered preliminary indicators of atypical spatial performance rather than diagnostic criteria, given the limited sample size used in this study.
Future research should prospectively validate these cutoffs in independent samples, ideally using preregistered thresholds, blinded group classification, and decision-analytic metrics such as positive and negative predictive values across plausible prevalence ranges [61]. Such validation would strengthen the translational potential of spatial hearing assessments for early detection of auditory aging.
Acknowledgments
The authors sincerely thank the Director of the All India Institute of Speech and Hearing and the head of the Department of Audiology for their support and for providing resources for the testing process. Heartfelt appreciation is also extended to all the participants for their valuable time and kind cooperation. Additionally, it is noteworthy that his study was conducted without any external funding.
Conflicts of interest
The authors declare no competing interests.
Data availability statement
Data are available on request from the authors.
Author contribution statement
HM contributed to the data acquisition and drafting of the manuscript. NKV contributed to the critical revision of the manuscript and supervision.
References
- J. Blauert: Spatial Hearing. The MIT Press, 1997. [Google Scholar]
- J. Blauert: Binaural localization. Scandinavian Audiology Supplementum 15 (1982) 7–26. [Google Scholar]
- S. Thavam, M. Dietz: Smallest perceivable interaural time differences. The Journal of the Acoustical Society of America 145 (2019) 458–468. [CrossRef] [PubMed] [Google Scholar]
- B.A. Wright, H. Dai: Discrimination thresholds for interaural-time differences and interaural-level differences in naïve listeners: sex differences and learning. Hearing Research 424 (2022) 108599. [Google Scholar]
- A.W. Mills: On the minimum audible angle. The Journal of the Acoustical Society of America 30 (1958) 237–246. [CrossRef] [Google Scholar]
- M. Alzaher, P. Serrano, J. Tardieu, P. Barone, M. Marx, P. Nieto: Contribution of a method of assessing minimum audible angle in headphones. European Annals of Otorhinolaryngology, Head and Neck Diseases 138 (2021) 333–336. [Google Scholar]
- D.R. Perrott, K. Saberi: Minimum audible angle thresholds for sources varying in both elevation and azimuth. The Journal of the Acoustical Society of America 87 (1990) 1728–1731. [Google Scholar]
- D.W. Grantham, B.W.Y. Hornsby, E.A. Erpenbeck: Auditory spatial resolution in horizontal, vertical, and diagonal planes. The Journal of the Acoustical Society of America 114 (2003) 1009–1022. [Google Scholar]
- R. Meng, J. Xiang, J. Sang, C. Zheng, X. Li, S. Bleeck, J. Cai, J. Wang: Investigation of an MAA test with virtual sound synthesis. Frontiers in Psychology 12 (2021) 656052. [Google Scholar]
- S. Goicke, F. Denk, T. Jürgens: Auditory spatial bisection of blind and normally sighted individuals in free field and virtual acoustics. Trends in Hearing 28 (2024) 23312165241230948. [Google Scholar]
- E. Aggius-Vella, A.J. Kolarik, M. Gori, S. Cirstea, C. Campus, B.C.J. Moore, S. Pardhan: Comparison of auditory spatial bisection and minimum audible angle in front, lateral, and back space. Scientific Reports 10 (2020) 6279. [Google Scholar]
- A.W. Lester, S.D. Moffat, J.M. Wiener, C.A. Barnes, T. Wolbers: The aging navigational system. Neuron 95 (2017) 1019–1035. [Google Scholar]
- S.M. Smith, L.T. Elliott, F. Alfaro-Almagro, P. McCarthy, T.E. Nichols, G. Douaud, K.L. Miller: Brain aging comprises many modes of structural and functional change with distinct genetic and biophysical associations. Elife 9 (2020) e52677. [Google Scholar]
- J.H. Grose, S.K. Mamo: Processing of temporal fine structure as a function of age. Ear and Hearing 31 (2010) 755–760. [Google Scholar]
- B.C.J. Moore, D.A. Vickers, A. Mehta: The effects of age on temporal fine structure sensitivity in monaural and binaural conditions. International Journal of Audiology 51 (2012) 715–721. [Google Scholar]
- K.L. Whiteford, H.A. Kreft, A.J. Oxenham: Assessing the role of place and timing cues in coding frequency and amplitude modulation as a function of age. Journal of the Association for Research in Otolaryngology 18 (2017) 619–633. [Google Scholar]
- J.H. Grose, H. Martini-Stoica, M. Folkerts, S. Kane, E. Buss: Psychophysical and electrophysiological measures of frequency modulation sensitivity: effects of age and interaural modulator phase. Ear and Hearing 46 (2025) 1295–1304. [Google Scholar]
- C. Vercammen, T. Goossens, J. Undurraga, J. Wouters, A. van Wieringen: Electrophysiological and behavioral evidence of reduced binaural temporal processing in the aging and hearing impaired human auditory system. Trends in Hearing 22 (2018) 2331216518785733. [Google Scholar]
- N.K. Srinivasan, K.M. Jakien, F.J. Gallun: Release from masking for small spatial separations: effects of age and hearing loss. The Journal of the Acoustical Society of America 140 (2016) EL73–EL78. [Google Scholar]
- F.J. Gallun, A.C. Diedesch, S.D. Kampel, K.M. Jakien: Independent impacts of age and hearing loss on spatial release in a complex auditory environment. Frontiers in Neuroscience 7 (2013) 252. [Google Scholar]
- F.J. Gallun, G.P. McMillan, M.R. Molis, S.D. Kampel, S.M. Dann, D.L. Konrad-Martin: Relating age and hearing loss to monaural, bilateral, and binaural temporal sensitivity. Frontiers in Neuroscience 8 (2014) 172. [Google Scholar]
- H. Babkoff, C. Muchnik, N. Ben-David, M. Furst, S. Even-Zohar, M. Hildesheimer: Mapping lateralization of click trains in younger and older populations. Hearing Research 165 (2002) 117–127. [Google Scholar]
- J.R. Dubno, J.B. Ahlstrom, A.R. Horwitz: Binaural advantage for younger and older adults with normal hearing. Journal of Speech, Language, and Hearing Research 51 (2008) 539–556. [Google Scholar]
- H. Glyde, S. Cameron, H. Dillon, L. Hickson, M. Seeto: The effects of hearing impairment and aging on spatial processing. Ear and Hearing 34 (2013) 15–28. [Google Scholar]
- N. Marrone, C.R. Mason, G. Kidd: The effects of hearing loss and age on the benefit of spatial separation between multiple talkers in reverberant rooms. The Journal of the Acoustical Society of America 124 (2008) 3064–3075. [Google Scholar]
- F.J. Gallun, V. Best: Age-Related Changes in Segregation of Sound Sources. Springer, 2020, pp. 143–171. [Google Scholar]
- J. Zwislocki, R.S. Feldman: Just noticeable differences in dichotic phase. The Journal of the Acoustical Society of America 28 (1956) 860–864. [Google Scholar]
- R.G. Klumpp, H.R. Eady: Some measurements of interaural time difference thresholds. The Journal of the Acoustical Society of America 28 (1956) 859–860. [CrossRef] [Google Scholar]
- A. Brughera, L. Dunai, W.M. Hartmann: Human interaural time difference thresholds for sine tones: the high-frequency limit. The Journal of the Acoustical Society of America 133 (2013) 2839–2855. [Google Scholar]
- K.V. Nisha, A.K. Uppunda, S. Konadath: Effects of maturation and chronological aging on auditory spatial processing: a cross-sectional study across life span. American Journal of Audiology 32 (2023) 119–134. [Google Scholar]
- K.V. Nisha, A.K. Uppunda, R.T. Kumar: Spatial rehabilitation using virtual auditory space training paradigm in individuals with sensorineural hearing impairment. Frontiers in Neuroscience 16 (2023) 1080398. [Google Scholar]
- M.J. Goupell: Age-related changes in interaural-level-difference-based across-frequency binaural interference. Frontiers in Aging Neuroscience 14 (2022) 887401. [Google Scholar]
- J. Koehnke, C.P. Culotta, M.L. Hawley, H.S. Colburn: Effects of reference interaural time and intensity differences on binaural performance in listeners with normal and impaired hearing. Ear and Hearing 16 (1995) 331–53. [Google Scholar]
- D.R. Perrott, K. Marlborough, P. Merrill, T.Z. Strybel: Minimum audible angle thresholds obtained under conditions in which the precedence effect is assumed to operate. The Journal of the Acoustical Society of America 85 (1989) 282–288. [Google Scholar]
- C.A. Sammeth, K.A. Walker, N.T. Greene, A. Klug, D.J. Tollin: Degradation in binaural and spatial hearing and auditory temporal processing abilities as a function of aging. BioRxiv (2024). DOI: https://doi.org/10.1101/2024.07.08.602575. [Google Scholar]
- C. Freigang, K. Schmiedchen, I. Nitsche, R. Rübsamen: Free-field study on auditory localization and discrimination performance in older adults. Experimental Brain Research 232 (2014) 1157–1172. [Google Scholar]
- M. Gori, G. Sandini, C. Martinoli, D.C. Burr: Impairment of auditory spatial localization in congenitally blind human subjects. Brain 137 (2014) 288–293. [Google Scholar]
- S. Finocchietti, D. Esposito, M. Gori: Monaural auditory spatial abilities in early blind individuals. Iperception 14 (2023) 20416695221149638. [Google Scholar]
- J. Bogon, C. Jagorska, E.M. Heinz, M. Riemer: Presentation time shapes perceived room size in visual and auditory modalities. Cognitive Research: Principles and Implications 10 (2025) 31. [Google Scholar]
- A. Gutschalk, A.R. Dykstra: Auditory neglect and related disorders. Handbook of Clinical Neurology 129 (2015) 557–571. [Google Scholar]
- K. Hopkins, B.C.J. Moore: The effects of age and cochlear hearing loss on temporal fine structure sensitivity, frequency selectivity, and speech reception in noise. The Journal of the Acoustical Society of America 130 (2011) 334–349. [Google Scholar]
- A. King, K. Hopkins, C.J. Plack: The effects of age and hearing loss on interaural phase difference discrimination. The Journal of the Acoustical Society of America 135 (2014) 342–351. [Google Scholar]
- A.C. Eddins, E.J. Ozmeral, D.A. Eddins: How aging impacts the encoding of binaural cues and the perception of auditory space. Hearing Research 369 (2018) 79–89. [Google Scholar]
- R. Orlikoff, N. Schiavetti, D. Metz: Evaluating Research in Communication Disorders, 7th edn. Pearson Education, 2014. [Google Scholar]
- R. Vaidyanath, A. Yathiraj: Screening checklist for auditory processing in adults (SCAP-A): development and preliminary findings. Journal of Hearing Science 4 (2014) 27–37. [Google Scholar]
- S. Chopra, H. Kaur, R. Pandey, A. Nehra: Development of neuropsychological evaluation screening tool: an education-free cognitive screening instrument. Neurology India 66 (2018) 391. [Google Scholar]
- Bhoomika, K.V. Nisha: Effects of musical training on auditory spatial processing abilities: a psychoacoustical and perceptual study, in: Advances in Speech and Music Technology: Proceedings of FRSM 2020. Springer Singapore, Singapore, 2021, pp. 261–273. [Google Scholar]
- K.V. Nisha, R. Durai, S. Konadath: Musical training and its association with age-related changes in binaural, temporal, and spatial processing. American Journal of Audiology 31 (2022) 669–683. [Google Scholar]
- F. Faul, E. Erdfelder, A.-G. Lang, A. Buchner: G*Power 3: a flexible statistical power analysis program for the social, behavioral, and biomedical sciences. Behavior Research Methods 39 (2007) 175–191. [CrossRef] [PubMed] [Google Scholar]
- World Medical Association: Declaration of Helsinki. JAMA 310 (2013) 2191. [CrossRef] [PubMed] [Google Scholar]
- A. Soranzo, M. Grassi: PSYCHOACOUSTICS: a comprehensive MATLAB toolbox for auditory testing. Frontiers in Psychology 5 (2014) 712. [Google Scholar]
- H. Levitt: Transformed up-down methods in psychoacoustics. The Journal of the Acoustical Society of America 49 (1971) 467–477. [CrossRef] [Google Scholar]
- M. Cuevas-Rodríguez, L. Picinali, D. González-Toledo, C. Garre, E. de la Rubia-Cuestas, L. Molina-Tanco, A. Reyes-Lecuona: 3D Tune-In Toolkit: an open-source library for real-time binaural spatialisation. PLoS One 14 (2019) e0211899. [CrossRef] [PubMed] [Google Scholar]
- D.M. Green, J.A. Swets: Signal Detection Theory and Psychophysics. 1st edn. Peninsula Publishing, 1996. [Google Scholar]
- L.R. Bernstein, C. Trahiotis: Behavioral manifestations of audiometrically-defined “slight” or “hidden” hearing loss revealed by measures of binaural detection. The Journal of the Acoustical Society of America 140 (2016) 3540–3548. [Google Scholar]
- S.M. Abel, C. Giguère, A. Consoli, B.C. Papsin: The effect of aging on horizontal plane sound localization. The Journal of the Acoustical Society of America 108 (2000) 743–52. [Google Scholar]
- Á. Boncz, O. Szalárdy, P.K. Velősy, L. Béres, R. Baumgartner, I. Winkler, B. Tóth: The effects of aging and hearing impairment on listening in noise. IScience 27 (2024) 109295. [Google Scholar]
- C. Jenny, C. Reuter: Usability of individualized head-related transfer functions in virtual reality: empirical study with perceptual attributes in sagittal plane sound localization. JMIR Serious Games 8 (2020) e17576. [CrossRef] [PubMed] [Google Scholar]
- F.L. Wightman, D.J. Kistler: Resolution of front–back ambiguity in spatial hearing by listener and source movement. The Journal of the Acoustical Society of America 105 (1999) 2841–2853. [CrossRef] [PubMed] [Google Scholar]
- E.A. Macpherson, J.C. Middlebrooks: Localization of brief sounds: effects of level and background noise. The Journal of the Acoustical Society of America 108 (2000) 1834–1849. [Google Scholar]
- H.N. Erb: Prior probability (the pretest best guess) affects predictive values of diagnostic tests. Veterinary Clinical Pathology 40 (2011) 154–158. [Google Scholar]
Appendix A
Audiometric covariate analyses
To control for potential confounding from hearing sensitivity and interaural asymmetry, pure-tone average (PTA), interaural PTA differences, and frequency-specific asymmetries (250–4000 Hz) were included as covariates in separate ANCOVAs for each dependent variable. A Bonferroni correction was applied within each dependent variable (m = 8 covariate tests), yielding an adjusted significance threshold of α′ = 0.00625.
Minimum Audible Angle (MAA)
Covariate tests were: PTA F(1, 35)=1.18, p = 0.285, partial η2 = 0.033;
PTA difference F(1, 35)=0.00, p = 0.995, partial η2 = 0.000;
250 Hz F(1, 35)=0.17, p = 0.680, partial η2 = 0.005;
500 Hz F(1, 35)=0.01, p = 0.911, partial η2 = 0.000;
1000 Hz F(1, 35)=0.94, p = 0.338, partial η2 = 0.026;
2000 Hz F(1, 35)=0.06, p = 0.803, partial η2 = 0.002;
4000 Hz F(1, 35)=0.00, p = 0.975, partial η2 = 0.000.
Interaural Time Difference (ITD)
Covariate tests were: PTA F(1, 35)=0.25, p = 0.620, partial η2 = 0.007;
PTA difference F(1, 35)=1.02, p = 0.320, partial η2 = 0.028;
250 Hz F(1, 35)=0.45, p = 0.508, partial η2 = 0.013;
500 Hz F(1, 35)=0.75, p = 0.393, partial η2 = 0.021;
1000 Hz F(1, 35)=4.27, p = 0.046, partial η2 = 0.109;
2000 Hz F(1, 35)=2.42, p = 0.129, partial η2 = 0.065;
4000 Hz F(1, 35)=3.16, p = 0.084, partial η2 = 0.083.
Interaural Level Difference (ILD)
Covariate tests were: PTA F(1, 35)=0.01, p = 0.929, partial η2 = 0.000;
PTA difference F(1, 35)=0.01, p = 0.945, partial η2 = 0.000;
250 Hz F(1, 35)=0.29, p = 0.595, partial η2 = 0.008;
500 Hz F(1, 35)=0.07, p = 0.789, partial η2 = 0.002;
1000 Hz F(1, 35)=1.09, p = 0.304, partial η2 = 0.030;
2000 Hz F(1, 35)=0.05, p = 0.834, partial η2 = 0.001;
4000 Hz F(1, 35)=0.29, p = 0.596, partial η2 = 0.008.
Bisection Accuracy
Covariate tests were: PTA F(1, 35)=2.84, p = 0.101, partial η2 = 0.075;
PTA difference, F(1, 35)=0.12, p = 0.727, partial η2 = 0.004;
250 Hz, F(1, 35)=0.03, p = 0.867, partial η2 = 0.001;
500 Hz, F(1, 35)=0.12, p = 0.727, partial η2 = 0.004;
1000 Hz, F(1, 35)=1.51, p = 0.227, partial η2 = 0.041;
2000 Hz, F(1, 35)=1.20, p = 0.280, partial η2 = 0.033;
4000 Hz, F(1, 35)=0.40, p = 0.530, partial η2 = 0.011.
Summary
After applying the Bonferroni-adjusted threshold (α′=0.00625), none of the audiometric covariates reached significance for any spatial measure. Although the 1000 Hz asymmetry showed an uncorrected effect on ITD (p = 0.046), it did not survive correction. Importantly, the main effect of Group remained robust for all spatial measures – MAA (F(1, 35)=71.67, p < 0.001), ITD (F(1, 35)=28.91, p < 0.001), ILD (F(1, 35)=17.32, p < 0.001), and bisection accuracy (F(1, 35)=16.01, p < 0.001) – indicating that group-level spatial performance differences persisted independent of PTA or interaural asymmetry.
Cite this article as: Mali H. & Nisha K.V. 2026. Early detection of age-related spatial processing decline: a cross-sectional analysis of four auditory measures. Acta Acustica, 10, 19. https://doi.org/10.1051/aacus/2026015.
All Tables
Summary of multivariate analysis of variance (MANOVA) results comparing spatial auditory discrimination measures across age groups. The table represents the F-values, Bonferroni corrected significance levels (p), and partial eta-squared (η p 2 ) effect sizes for interaural time differences (ITD), interaural level differences (ILD), minimum audible angle (MAA) and bisection accuracy (BA).
Receiver Operating Characteristic (ROC) Analyses for spatial auditory spatial discrimination measures, including interaural time differences (ITD), interaural level differences (ILD), minimum audible angle (MAA) and bisection accuracy (BA). The table reports sensitivity, specificity, area under the curve (AUC) with standard error (SE), Youden’s Index, optimal cut-off values for distinguishing between young and middle-aged adults. Higher AUC vales indicate greater diagnostic accuracy.
Cross validated accuracy of discriminant function analyses comparing predicted group membership. Total participants (number count) are tabulated with the corresponding percentage in parentheses.
All Figures
|
Figure 1. Left–right threshold differences (dB) across frequencies (0.25–4k Hz) in young and middle-aged adults. Each box shows the mean, SD, and individual data points, with zero representing perfect interaural symmetry. While middle-aged adults (green) exhibit slightly greater variability, group differences in interaural threshold asymmetry were not statistically significant. |
| In the text | |
|
Figure 2. (A), (B) and (C) show the schematic representation of ITD, ILD and MAA tasks, respectively. (D) GUI used for ITD, ILD and MAA tasks. |
| In the text | |
|
Figure 3. Interface of 3DTI. |
| In the text | |
|
Figure 4. Schematic representation of VABT task. |
| In the text | |
|
Figure 5. GUI used for Stimulus Familiarization (left panel), both the task familiarization and the test phase (right panel). |
| In the text | |
|
Figure 6. Raincloud plots illustrating group-wise distributions of spatial discrimination measures in young (green) and middle-aged (purple) adults. Each raincloud combines raw data points (left), boxplots (center), and half-violin density plots (right), visualizing both individual variability and overall distribution shape. Panel A: Interaural Time Difference (ITD) thresholds (ms);Panel B: Interaural Level Difference (ILD) thresholds (dB);Panel C: Minimum Audible Angle (MAA) thresholds (degrees);Panel D: Bisection Accuracy (BA) scores. |
| In the text | |
|
Figure 7. Comparison of ROC curves for each of the auditory spatial discrimination measures. The x-axis shows false positive rate (1-specificity), and the y-axis shows true positive rate (sensitivity). Higher area under curve values indicates better discrimination. |
| In the text | |
|
Figure 8. Proportion of “Right” responses on bisection accuracy task across azimuths for young and middle-aged adults. Symbols indicate mean values and error bars represent ±1 standard deviation both in percentage units. Both groups showed low “Right” response rates for leftward sources and increasing probabilities with rightward azimuths. |
| In the text | |
|
Figure 9. Group-wise comparison of sensitivity index (d′) across spatial separations (15°, 30°, 45°, 60°) from bisection accuracy task. Raincloud plots show the distribution and mean of d′ values for young adults (purple) and middle-aged adults (green). Shaded regions represent kernel density estimates, with boxplots. |
| In the text | |
|
Figure 10. Bar graphs representing the discriminant function scores for the segregation of both the groups. The dotted line is the reference for cut-off scores between the groups on the discriminant function. |
| In the text | |
Current usage metrics show cumulative count of Article Views (full-text article views including HTML views, PDF and ePub downloads, according to the available data) and Abstracts Views on Vision4Press platform.
Data correspond to usage on the plateform after 2015. The current usage metrics is available 48-96 hours after online publication and is updated daily on week days.
Initial download of the metrics may take a while.