Figure 9.
Download original image
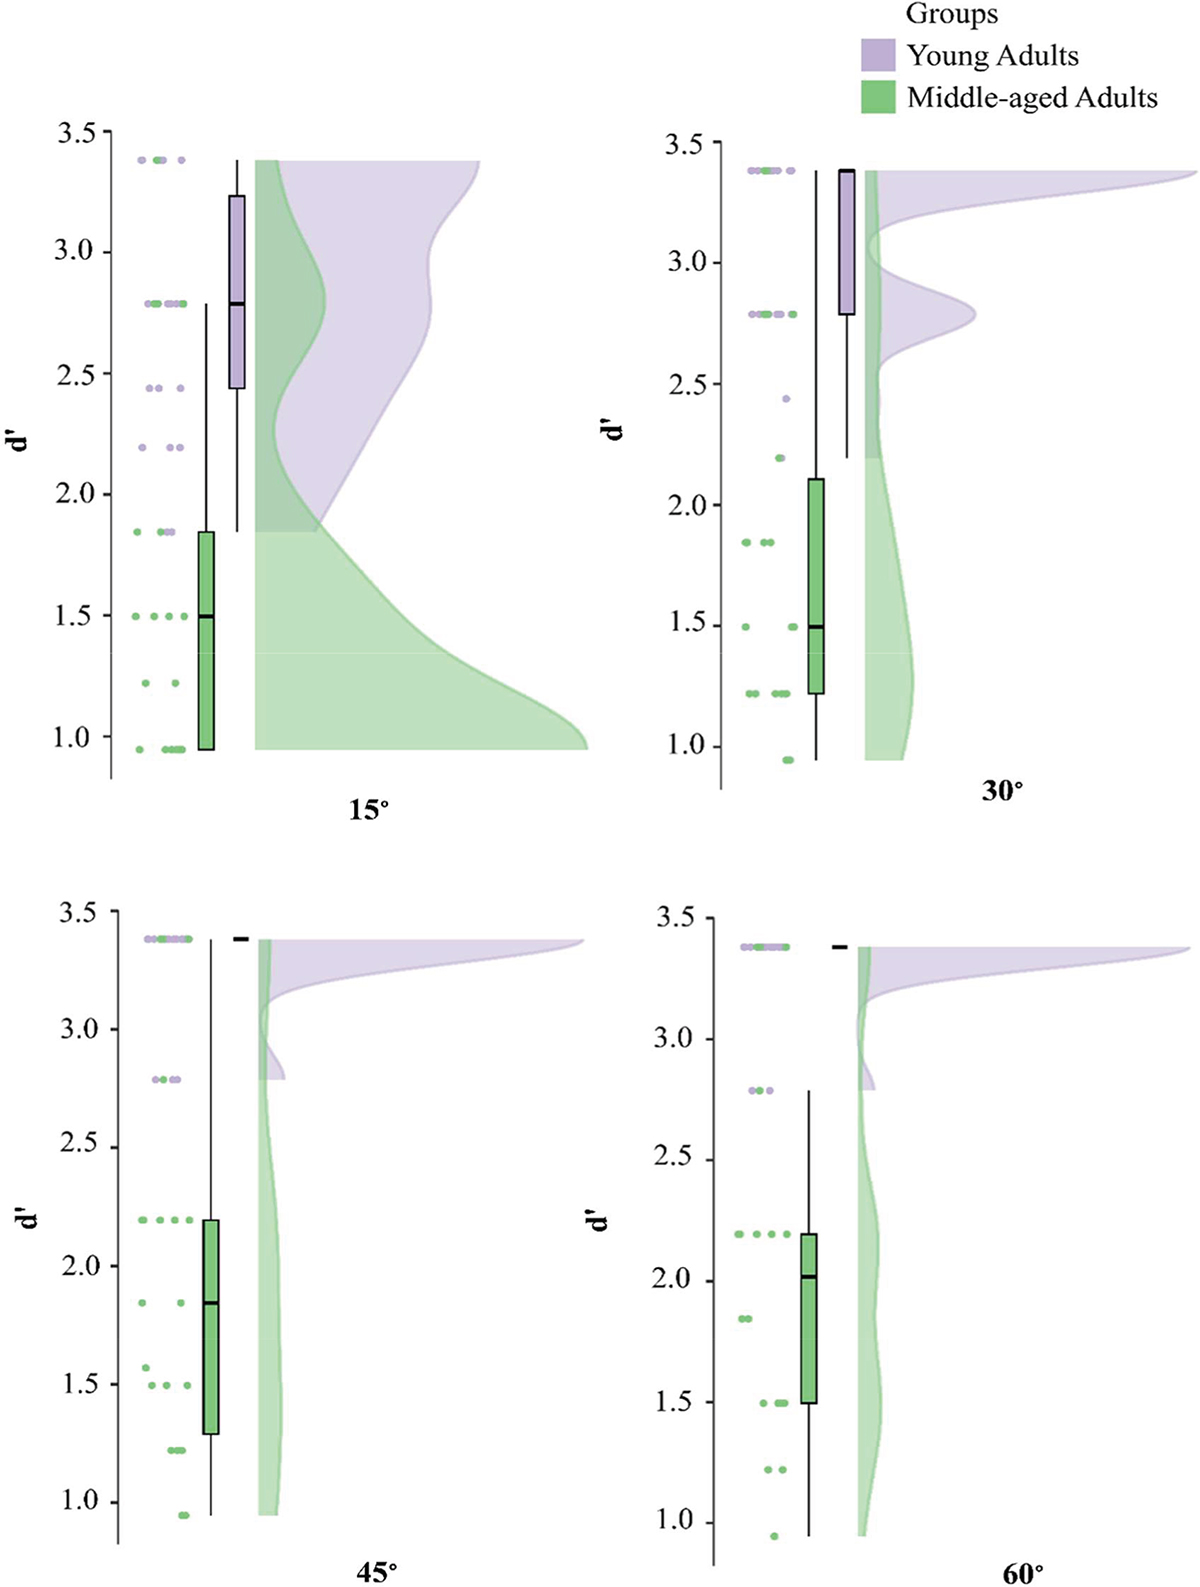
Group-wise comparison of sensitivity index (d′) across spatial separations (15°, 30°, 45°, 60°) from bisection accuracy task. Raincloud plots show the distribution and mean of d′ values for young adults (purple) and middle-aged adults (green). Shaded regions represent kernel density estimates, with boxplots.
Current usage metrics show cumulative count of Article Views (full-text article views including HTML views, PDF and ePub downloads, according to the available data) and Abstracts Views on Vision4Press platform.
Data correspond to usage on the plateform after 2015. The current usage metrics is available 48-96 hours after online publication and is updated daily on week days.
Initial download of the metrics may take a while.