Figure 2.
Download original image
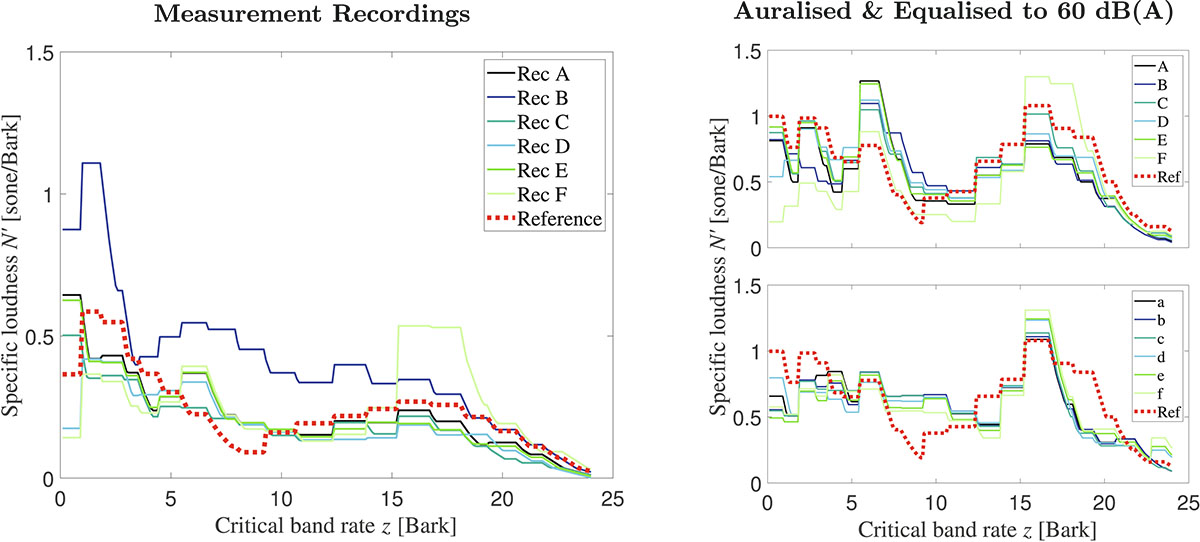
Specific loudness N′ as a function of critical band rate z: The left plot shows the measurement recordings A to F along with the reference stimulus, while the right plot depicts the stimuli used in the listening experiments after being auralised and equalised to 60 dB(A). The top panel on the right displays the stimuli from the first heat pump (A–F), whereas the bottom panel shows the stimuli from the second heat pump (a–f), each compared with the auralised reference, also at 60 dB(A). Depicted are the values for the left ear.
Current usage metrics show cumulative count of Article Views (full-text article views including HTML views, PDF and ePub downloads, according to the available data) and Abstracts Views on Vision4Press platform.
Data correspond to usage on the plateform after 2015. The current usage metrics is available 48-96 hours after online publication and is updated daily on week days.
Initial download of the metrics may take a while.