Figure 5.
Download original image
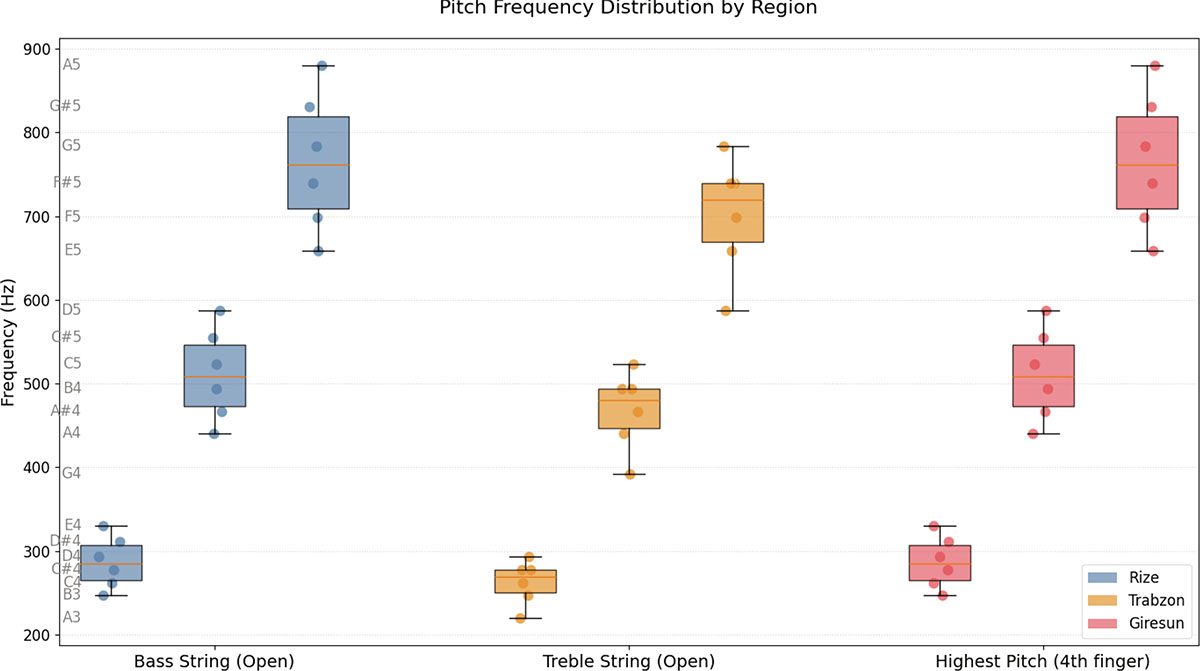
Regional variations in pitch frequencies of Karadeniz kemenche samples. Box plots show distributions of (A) bass string open frequencies, (B) treble string open frequencies, and (C) highest fingered pitches, grouped by construction region (Rize: blue, Trabzon: orange, Giresun: red). Boxes span the 25th–75th percentiles with median lines; whiskers extend to 1.5 × IQR; individual points represent samples. Open-string frequencies were measured with a digital tuner (±1 cent) on strings tuned at time of measurement. Structural modal frequency bands (Mode 2: 253 Hz; Modes 3–4: 432–457 Hz; Mode 9: 987 Hz) are overlaid as grey bands to highlight structural-acoustic coupling. Significant regional differences were confirmed by non-parametric Kruskal–Wallis tests (p < 0.01 for all frequency ranges) with effect sizes (η2) reported in the text.
Current usage metrics show cumulative count of Article Views (full-text article views including HTML views, PDF and ePub downloads, according to the available data) and Abstracts Views on Vision4Press platform.
Data correspond to usage on the plateform after 2015. The current usage metrics is available 48-96 hours after online publication and is updated daily on week days.
Initial download of the metrics may take a while.