Figure 7.
Download original image
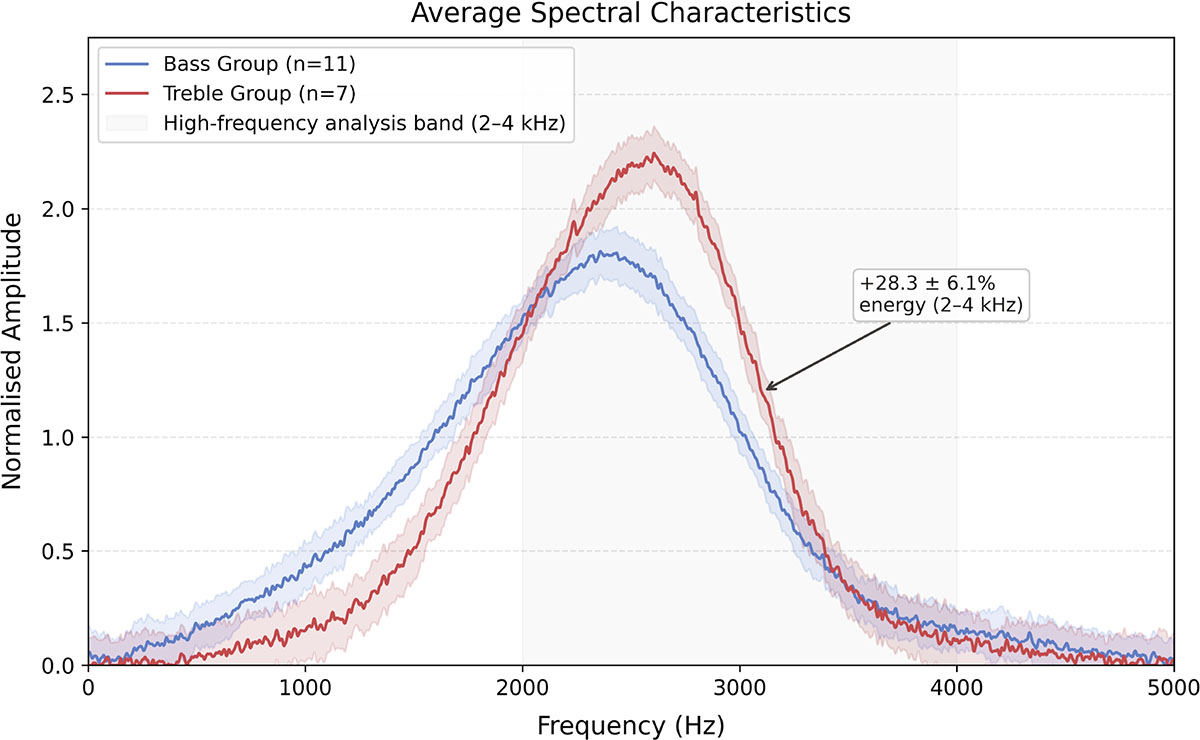
Average power spectral density of bass-oriented (blue, n = 11) and treble-oriented (red, n = 7) kemenche samples. Each instrument was played by an experienced performer executing a standardised bowing pattern (open strings, mezzo-forte, 3 repetitions per instrument). Recordings were made with a Neumann TLM 170R cardioid condenser microphone at 50 cm distance, 45° off-axis, in an acoustically treated room (RT60 ≈ 0.3 s at 1 kHz; background noise < 30 dB(A)). Power spectral density was computed using Welch’s method (Hanning window, 50% overlap, 4096-point FFT, 44.1 kHz sampling rate), normalised by total energy (0–5 kHz), and averaged within each group. Shaded bands represent ±1 standard deviation across instruments within each group. The grey shaded region marks the high-frequency analysis band (2–4 kHz). Treble-oriented instruments demonstrate 28.3 ± 6.1% (bootstrap 95% CI) greater high-frequency energy in the 2–4 kHz band.
Current usage metrics show cumulative count of Article Views (full-text article views including HTML views, PDF and ePub downloads, according to the available data) and Abstracts Views on Vision4Press platform.
Data correspond to usage on the plateform after 2015. The current usage metrics is available 48-96 hours after online publication and is updated daily on week days.
Initial download of the metrics may take a while.