Figure 9.
Download original image
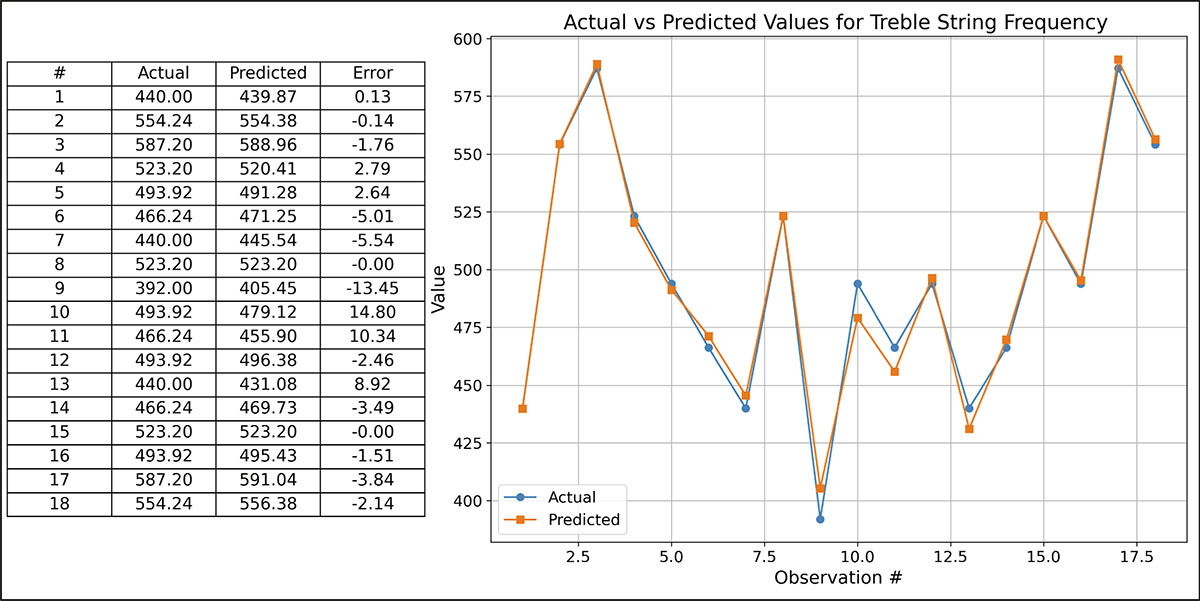
Actual versus predicted treble string frequencies (Yeo–Johnson transformed, λ = 1.1301). Each point represents one instrument, coded by body material (symbol) and group membership (colour: bass-oriented = blue, treble-oriented = red). The shaded band represents the 95% bootstrap confidence interval around the regression line. Predictions show closest alignment for typical treble-oriented samples (mulberry body, 0.25 mm soundboards; Sect. 3.2), with larger deviations for transitional Sample 16, which combines treble-range materials with bass-like modal properties. Model was validated using leave-one-out prediction.
Current usage metrics show cumulative count of Article Views (full-text article views including HTML views, PDF and ePub downloads, according to the available data) and Abstracts Views on Vision4Press platform.
Data correspond to usage on the plateform after 2015. The current usage metrics is available 48-96 hours after online publication and is updated daily on week days.
Initial download of the metrics may take a while.