Figure 15.
Download original image
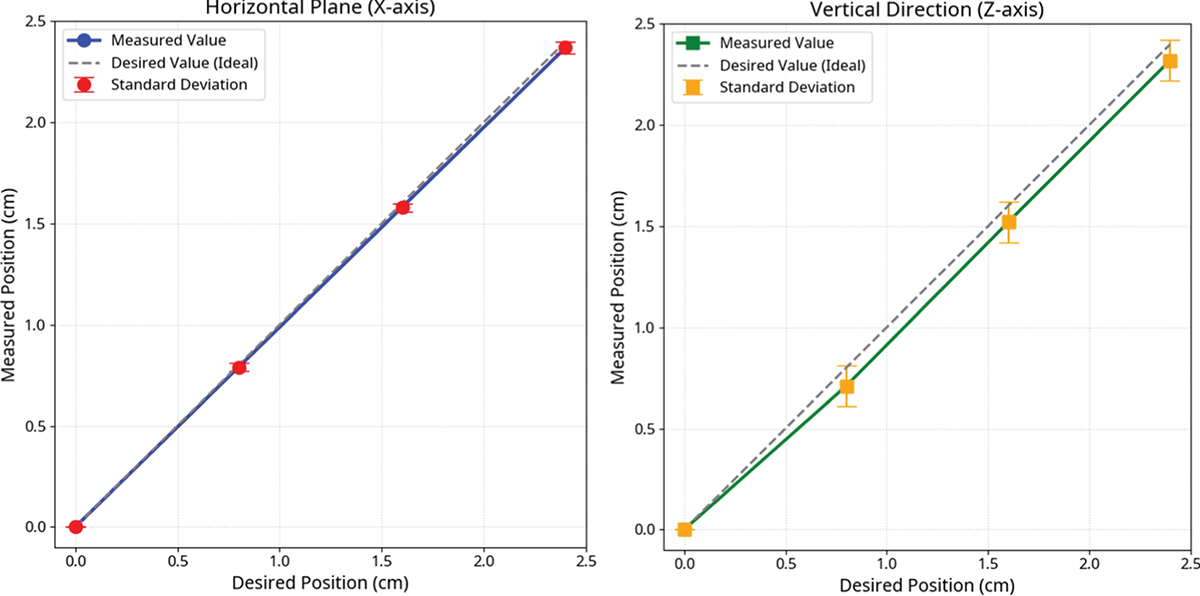
Precision and instability limits of vortex-based particle translation. Left: Horizontal (x-axis) motion. Right: Vertical (z-axis) motion. Blue/green dots: mean position (n = 7). Dashed line: ideal target. Red/orange squares: ± standard deviation. All axes in cm. Data show high x-axis precision (σ ≤ 0.03 cm) and pronounced z-axis instability (σ = 0.10 cm), defining the operational boundary of vortex fields.
Current usage metrics show cumulative count of Article Views (full-text article views including HTML views, PDF and ePub downloads, according to the available data) and Abstracts Views on Vision4Press platform.
Data correspond to usage on the plateform after 2015. The current usage metrics is available 48-96 hours after online publication and is updated daily on week days.
Initial download of the metrics may take a while.