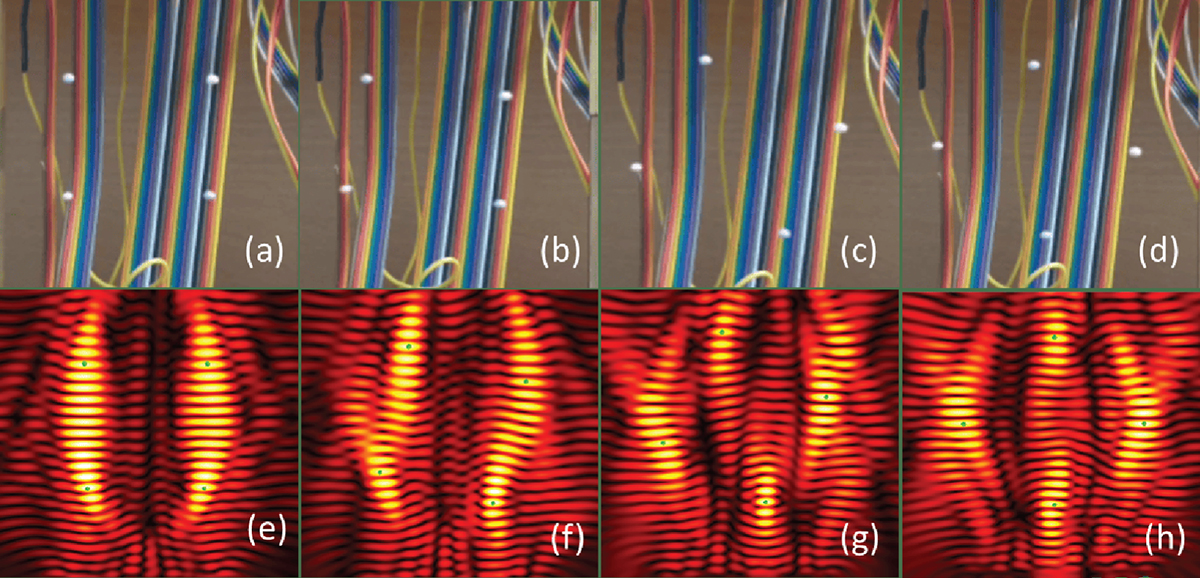
Figure 16.
Download original image
Independent control and rotational stability of four particles. (a)–(d) Physical diagrams showing particle positions during clockwise rotation around the rectangle’s center: (a) 0°, (b) 15°, (c) 30°, (d) 45°. (e)–(h) Corresponding acoustic field simulations: (e) 0°, (f) 15°, (g) 30°, (h) 45°. Panels (a)–(d) show top-down views of the experimental setup. Panels (e)–(h) show simulated pressure amplitude fields (color scale: red = high pressure, black = low pressure), with green dots indicating target focal positions.
Current usage metrics show cumulative count of Article Views (full-text article views including HTML views, PDF and ePub downloads, according to the available data) and Abstracts Views on Vision4Press platform.
Data correspond to usage on the plateform after 2015. The current usage metrics is available 48-96 hours after online publication and is updated daily on week days.
Initial download of the metrics may take a while.