| Issue |
Acta Acust.
Volume 8, 2024
|
|
|---|---|---|
| Article Number | 3 | |
| Number of page(s) | 12 | |
| Section | Hearing, Audiology and Psychoacoustics | |
| DOI | https://doi.org/10.1051/aacus/2023064 | |
| Published online | 09 January 2024 | |
Supplementary figures
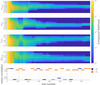 |
Figure S1: Compound likelihood (mean over the other three parameters and all stimulus parameters after setting the maximum of each trial to zero) for each of the four model parameters in the upper four panels for subject S1. The stimuli chosen by the procedure across trials are shown in the bottom panel. The dashed black line indicates the end of the initialization blocks and the start of the model steering with trial number 113. |
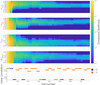 |
Figure S2: Compound likelihood (mean over the other three parameters and all stimulus parameters after setting the maximum of each trial to zero) for each of the four model parameters in the upper four panels for subject S2. The stimuli chosen by the procedure across trials are shown in the bottom panel. The dashed black line indicates the end of the initialization blocks and the start of the model steering with trial number 113. |
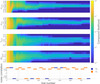 |
Figure S3: Compound likelihood (mean over the other three parameters and all stimulus parameters after setting the maximum of each trial to zero) for each of the four model parameters in the upper four panels for subject S3. The stimuli chosen by the procedure across trials are shown in the bottom panel. The dashed black line indicates the end of the initialization blocks and the start of the model steering with trial number 113. |
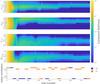 |
Figure S4: Compound likelihood (mean over the other three parameters and all stimulus parameters after setting the maximum of each trial to zero) for each of the four model parameters in the upper four panels for subject S5. The stimuli chosen by the procedure across trials are shown in the bottom panel. The dashed black line indicates the end of the initialization blocks and the start of the model steering with trial number 113. |
© The Author(s), Published by EDP Sciences, 2024
Current usage metrics show cumulative count of Article Views (full-text article views including HTML views, PDF and ePub downloads, according to the available data) and Abstracts Views on Vision4Press platform.
Data correspond to usage on the plateform after 2015. The current usage metrics is available 48-96 hours after online publication and is updated daily on week days.
Initial download of the metrics may take a while.