Open Access
Figure 5
Download original image
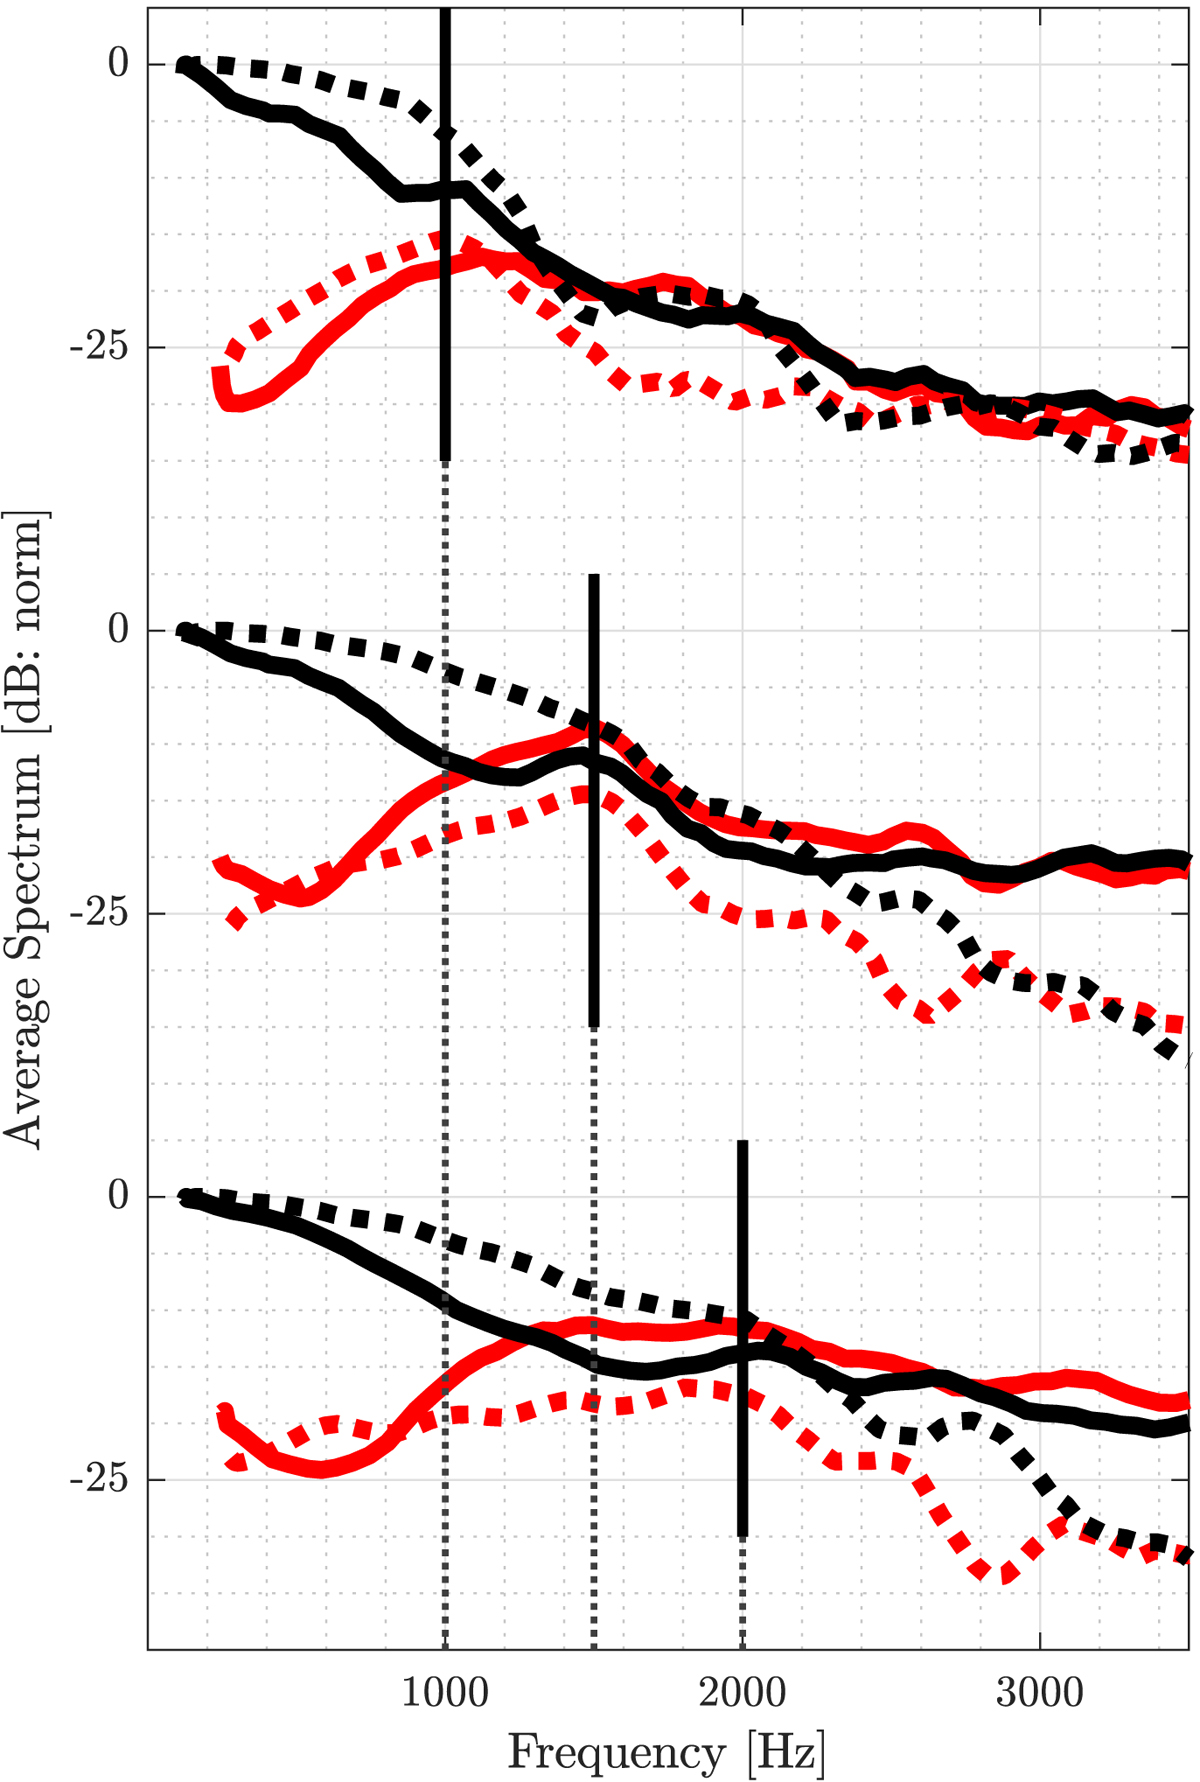
Comparison between measured (solid) and simulated (dashed) external spectra in a decibel representation for three resonators with cutoffs f c = 1.0, 1.5, 2.0 kHz at forte playing conditions. Odd harmonics are depicted in black and even harmonics in red. Synthesis control parameters provided in Section 4.2.
Current usage metrics show cumulative count of Article Views (full-text article views including HTML views, PDF and ePub downloads, according to the available data) and Abstracts Views on Vision4Press platform.
Data correspond to usage on the plateform after 2015. The current usage metrics is available 48-96 hours after online publication and is updated daily on week days.
Initial download of the metrics may take a while.