Figure 4
Download original image
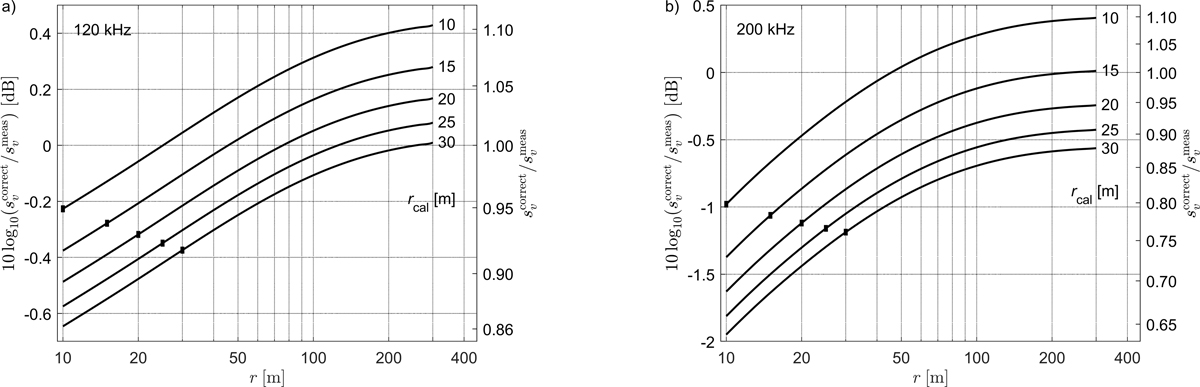
Numerically calculated example values for the finite-amplitude correction factor ![]() , with sound propagation parameters from Table 1 and 1000 W power setting for both calibration at range rcal and sv measurement at range r. The calibration range is indicated with a mark on each curve. Logarithmic scale, with corresponding ratios shown on the right-hand ordinate axis. (a) 120 kHz, (b) 200 kHz.
, with sound propagation parameters from Table 1 and 1000 W power setting for both calibration at range rcal and sv measurement at range r. The calibration range is indicated with a mark on each curve. Logarithmic scale, with corresponding ratios shown on the right-hand ordinate axis. (a) 120 kHz, (b) 200 kHz.
Current usage metrics show cumulative count of Article Views (full-text article views including HTML views, PDF and ePub downloads, according to the available data) and Abstracts Views on Vision4Press platform.
Data correspond to usage on the plateform after 2015. The current usage metrics is available 48-96 hours after online publication and is updated daily on week days.
Initial download of the metrics may take a while.