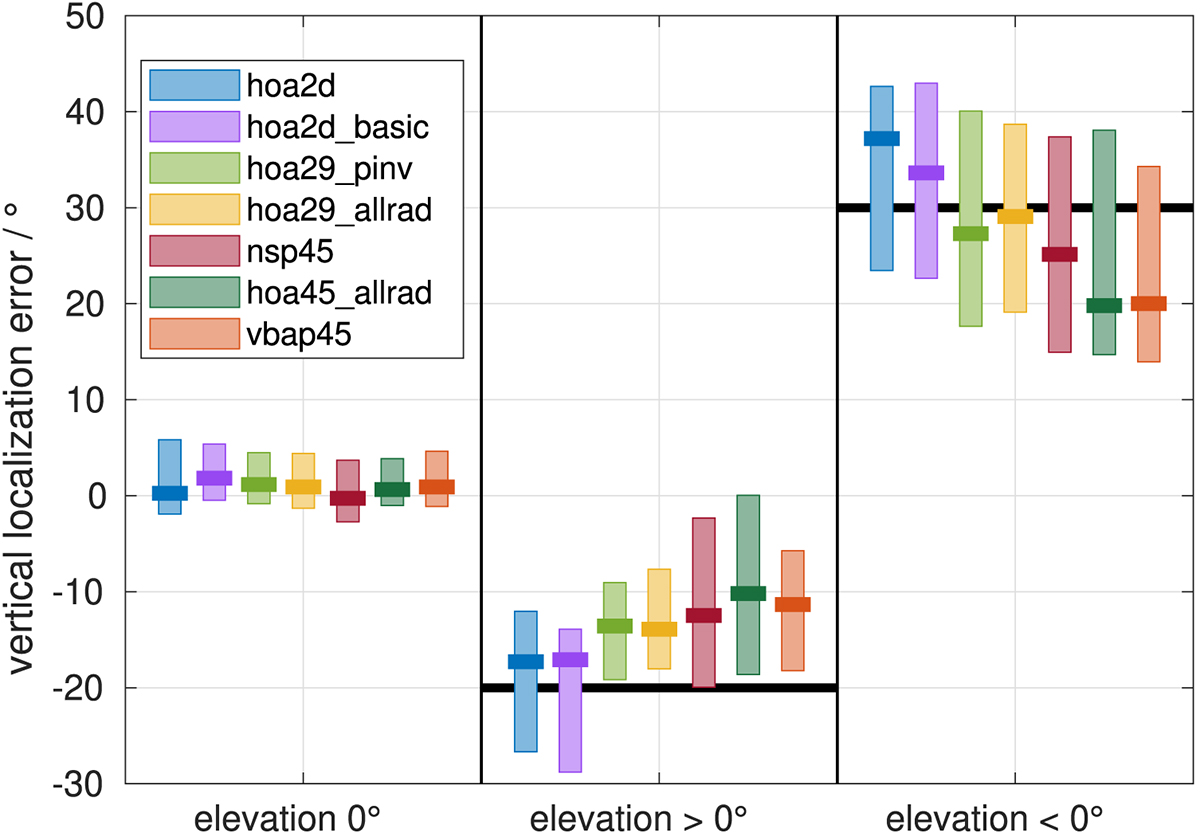
Figure 2
Download original image
Median and interquartile range of the vertical localization error, pooled across test participants and source positions. The black lines represent the negative median elevation of tested virtual positions of the respective elevation group; values close to those values mean that the sources were localized on the equatorial plane.
Current usage metrics show cumulative count of Article Views (full-text article views including HTML views, PDF and ePub downloads, according to the available data) and Abstracts Views on Vision4Press platform.
Data correspond to usage on the plateform after 2015. The current usage metrics is available 48-96 hours after online publication and is updated daily on week days.
Initial download of the metrics may take a while.