| Issue |
Acta Acust.
Volume 9, 2025
|
|
|---|---|---|
| Article Number | 64 | |
| Number of page(s) | 18 | |
| Section | Virtual Acoustics | |
| DOI | https://doi.org/10.1051/aacus/2025043 | |
| Published online | 22 October 2025 | |
Scientific Article
Reproduction of simulated acoustic scenes for clinical and hearing research in a reverberant room using four horizontal loudspeakers
Department of Medical Physics and Acoustics, Cluster of Excellence, Hearing4all, Carl von Ossietzky Universität Oldenburg, Oldenburg, Germany
* Corresponding author: This email address is being protected from spambots. You need JavaScript enabled to view it.
Received:
16
May
2025
Accepted:
25
August
2025
Abstract
When reproducing a virtual acoustic environment over loudspeakers within a reverberant playback room, the acoustics of the playback space can modify the spectral and spatial properties of the virtual environment considerably. Traditionally, optimal loudspeaker rendering of such scenes requires dedicated loudspeaker setups positioned in an anechoic room, employing techniques like Vector-BaseAmplitude Panning (VBAP) to render virtual reverberant sources, or Higher Order Ambisonics (HOA) to render spherical harmonics each using a large number of loudspeakers. In this study we evaluate to what extent it is possible to reproduce virtual acoustic environments using only a limited number of loudspeakers placed within a normal echoic room. Recently, we proposed a perceptually-based method using only four loudspeakers that specifically aims to compensate the detrimental effects of reverberation of the playback room by separately reproducing optimized versions of the direct and reverberant sound fields [Fallah et al., Reproduction of simulated acoustic scenes with limited number of loudspeakers in a reverberant room (2023)]. In this study, this approach is explained in more detail, and specifically an important parameter that controls the power ratio between direct and reverb sounds is investigated in detail using objective and subjective evaluations. In listening tests, the similarity of this proposed Acoustic Room Transformation (ART) method is compared to that of a reference rendering of the virtual acoustic environment within an anechoic room. The results of listening tests show significant improvements in the timbral and spatial characteristics of reproduced sound using the ART method compared to conventional playback without room compensation and show a closer match to the reference simulated environment.
Key words: Virtual acoustics / Room simulation / Acoustic Room Transformation (ART) / Spatial rendering in room
© The Author(s), Published by EDP Sciences, 2025
 This is an Open Access article distributed under the terms of the Creative Commons Attribution License (https://creativecommons.org/licenses/by/4.0), which permits unrestricted use, distribution, and reproduction in any medium, provided the original work is properly cited.
1 Introduction
Room simulation methods play an important role in virtual acoustics, facilitating the creation of immersive audio environments, particularly in applications such as music production, gaming, virtual reality, and also in research on auditory perception. Most room simulation methods allow for rendering on both headphones and loudspeakers [1–4], and can reach perceptually accurate renderings of real acoustic environments. In applications of such rendering techniques, using loudspeakers instead of headphones allows for more ecologically valid experiments where subjects will feel less constrained, which may help to ensure that the results obtained are applicable to real-world scenarios. In addition, wearing hearing aids becomes possible when using loudspeaker-based renderings [5].
In such loudspeaker-based rendering setups of virtual environments, the reproduction is preferably performed in an anechoic room to avoid any possible detrimental effects of an echoic reproduction room. For example, RAZR [4, 6], which uses image sources for direct sound and early reflections combined with a feedback delay network to render late reverberation, was demonstrated to allow for perceptually highly plausible renderings [7], where listeners had difficulty distinguishing between simulated and real rooms. The Simulated Open-Field Environment (SOFE) [8] is a system that simulates and reproduces audio–visual environments in an anechoic laboratory setting. This system consists of a visual display, a loudspeaker array, and a head-tracking device that allows for the creation of a 3D sound field. Besides methods that aim to simulate room acoustics based on computed room acoustics, there are also approaches using recorded spatial room impulse responses (RIRs) that aim for reproduction on loudspeakers such as spatial impulse response rendering (SIRR) [9].
Although many of these reproduction methods are designed for use in acoustically controlled environments such as anechoic rooms, practical applications often involve playback in typical echoic spaces, where the room itself can influence the perceived sound field. The effect of an echoic reproduction room has been investigated in the context of the reproduction of recorded sound. When reproducing recorded audio in an echoic room over loudspeakers, a so-called “room-in-room” impulse response (RinR) is created which has been found to substantially change perceptual and spatial properties of the recorded sound field. It was found to increase the reverberation time (T60), strongly modify the perceivedcoloration, change the temporal envelope of the early reflections, increase spectral modulation strength, and decrease speech intelligibility, all of which indicated that an unnatural and impaired listening experience may result [10]. The perception and preference of reverberation in small listening rooms with multi-loudspeaker reproduction was also investigated in [11]. The outcomes of this study emphasize the role of reverberation and decay times in residential listening environments, influencing the perceived sound field in terms of spectral modifications at lower frequencies.
The Loudspeaker-based Room Auralization (LoRA) [12] uses multiple loudspeakers placed to simulate sound sources and reflections within a virtual acoustic space. A significant part of this research was dedicated to optimizing the placement, calibration, and control of these loudspeakers to ensure that they could accurately reproduce the desired sound fields. Here, an equalization stage adjusts the frequency response of the loudspeakers to ensure that sound is reproduced with accurate tonal balance, where this compensation allows correcting for issues related to speaker directionality, distance, and room acoustics, among other factors. These techniques are critical for achieving a faithful recreation of the target room’s acoustics and ensuring that the listener experiences a highly realistic sound field.
In a typical clinical setting, there is no access to anechoic rooms or large loudspeaker setups, and it will be difficult to render virtual acoustic environments. Despite these limitations, spatially rendered virtual environments are increasingly relevant for audiological diagnostics and hearing aid evaluation, as they allow for ecologically valid testing scenarios [13]. More specifically, usingvirtual acoustic environments would allow assessing the ability of hearing-impaired listeners to cope with reverberant acoustic scenes in a standardized manner such that clinical outcomes will be highly similar independent of the reproduction room. Therefore, it would be desirable to reproduce a simulated virtual acoustic environment on only a limited number of loudspeakers placed in a normal reverberant room.
A cost-effective Virtual Sound Environment (VSE) reproduction system was developed in [14] that is specifically designed for clinical applications in compact indoor spaces. The system employs a spherical array comprising 16 commercially available loudspeakers for the reproduction of sound fields utilizing 3rd-order Ambisonics encoding. The study emphasizes the effective calibration of this spatial sound reproduction system within small environments using Higher Order Ambisonics (HOA). However, this Ambisonic reproduction system is limited by accurate sound field reconstruction only up to 1.9 kHz, issensitive to interference from room modes at low frequencies, and is prone to potential localization errors outside the sweet spot. An economical virtual acoustics system incorporating two loudspeakers employing crosstalk cancellation (CTC) to recreate authentic pressure signals for users of hearing-assistive devices was developed in [15]. The suitability of this system for replicating signals and accommodating head rotations is reported, indicating its promise in expanding accessibility to ecologically valid audiological testing and improving clinical assessments for individuals using hearing-assistive devices. However, the CTC method is limited by restricted spatial resolution and variability in performance due to room acoustics.
Considering these limitations and the need for a system that balances spatial realism, cost efficiency, and clinical practicality, we proposed a method that utilizes only four horizontally arranged loudspeakers placed in a typical echoic room. This method aims to faithfully reproduce the perceptually relevant acoustic cues present in the virtual acoustic environment. It is based on a previous study introduced in [16], later extended for recording with a microphone array and reproduction over a loudspeaker array placed in an echoic environment [17]. In both studies, the direct and reverberant parts of a recorded sound field are captured, and spectrally and spatially optimized according to perceptual criteria to allow a rendering in a reverberant playback room, making sure the reproduced sound field perceptually closely matches the original recorded sound field. In essence, this method aims to match spectral and spatial properties of the sound field in the recording and reproduction room and achieves this by time-invariant filtering operations and cross-mixing. More specifically, for the spatial properties, it focuses on directional spatial properties of the direct sound, and spatial diffuseness properties for the reverberant sound field. Interestingly, when a virtual acoustic scene is created with a room acoustical simulator such as RAZR [4], the direct and reverberant sound fields are already separately available and do not need to be captured. In this study, we applied the established Acoustic Room Transformation (ART) method [18] to render a simulated room in a typical echoic environment. As an extension of that work, we provide a more detailed description of the approach and highlight a key parameter, the separation time of binaural room impulse responses, which influences the ratio of direct-to-reverberant sound. The role of this parameter is investigated in detail using perceptual tests.
The paper is organized as follows: Section 2 outlines the structure of the proposed rendering method, including the general framework of the ART approach, the optimization process, and the ART filtering strategy. Section 3 presents the results of the optimization and listening experiment, reporting the performance of the ART system in terms of general, timbral, and spatial similarity to the reference sounds. Finally, Section 4 concludes the paper.
2 Method
2.1 General structure of ART
This section describes the structure of the Acoustic Room Transformation (ART) method that allows reproducing a simulated room with good quality on a limited number of loudspeakers in a reverberant room. A block diagram of the ART approach is depicted in Figure 1. First, a virtual acoustic environment is simulated using the RAZR tool [4]. RAZR generates two outputs: a simulated reference binaural room impulse response (BRIRref) at the listener’s position, used for headphone rendering, and virtual acoustic sources (VASs) for the direct and reverberant sound components, used for loudspeaker rendering. The simulated BRIRref serves as a reference both in the optimization process and in the subsequent listening tests. In addition to generating BRIRs for headphone rendering, RAZR also provides audio renderings of simulated rooms for spherical loudspeaker arrays placed in anechoic environments.
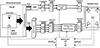 |
Figure 1 A block diagram of the ART approach. The RAZR room simulator provides two outputs: binaural room impulse responses (BRIRs) at the listener position for headphone rendering, and virtual acoustic sources (VASs) for the direct and reverberant components for loudspeaker rendering. In the upper signal flow, the VASs of the direct sound are mapped onto two loudspeakers using the Vector Base Amplitude Panning (VBAP) method, and the signals are rendered in the playback room after filtering. In the lower signal flow, the VASs of the reverberant sound are mapped onto four loudspeakers using spatial mixing. These signals are then mixed and filtered to control both the interaural coherence (IC) and the reverberant energy at the listening position in the playback room. To preserve the energy characteristics of the original signals, both the direct and reverberant components are compensated using Gammatone filterbank analysis and synthesis prior to playback. In the optimization block, the simulated BRIRs (BRIRref) are compared with the reproduced binaural room-in-room impulse responses (BRinR) measured in the playback room. This comparison is used to determine the optimal mixing coefficients for the reverberant signals, as well as the optimal Gammatone filter gains for both direct and reverberant components. Additionally, the reproduced reverberation time (T60) is controlled by adjusting the separation time between the direct and reverberant parts in both BRIRref and BRinR. |
In this setup, simulated Virtual Acoustic Sources (VASs), representing the direct and reverberant sound fields, can be mapped onto the loudspeaker array using the Vector Base Amplitude Panning (VBAP) method [19]. We use these VASs as the basis for generating audio signals to be rendered on the four loudspeakers in the reproduction room. A virtual acoustic source simulated in RAZR is denoted by VAS(α, Δt, Θ). It is characterized by its amplitude α, time delay Δt, and angle of arrival (Θ = (θ, φ)), where θ and φ are elevation and azimuth angles, respectively.
The upper signal flow in Figure 1 corresponds to the rendering of the direct sound. In the simulated scenario, the direct sound arrives from a direction between the two front loudspeakers on the horizontal plane (θ = 0).Using VBAP, the signal is mapped onto the two loudspeakers to create a phantom source, which is perceived as coming from between them. This is a standard technique in stereo playback. The direct-sound output from the room simulator VASdir(α, Δt, (0, φ)) in the horizontal plane is mapped onto these loudspeakers, denoted by L1, d[n] for loudspeaker number one at the azimuthal angle of 45° and L2, d[n] at the azimuthal angle of −45°:
![Mathematical equation: $$ \begin{aligned} \begin{split} L_{1,d}[n]&= \text{ VBAP}_{(0,45)}\!\mathopen \mathclose {\left\{ \text{ VAS}^{\text{ dir}}(\alpha ,\mathrm{\Delta } t,(0,\varphi )) \right\} }, \\ L_{2,d}[n]&= \text{ VBAP}_{(0,-45)}\!\mathopen \mathclose {\left\{ \text{ VAS}^{\text{ dir}}(\alpha ,\mathrm{\Delta } t,(0,\varphi )) \right\} }. \end{split} \end{aligned} $$](/articles/aacus/full_html/2025/01/aacus250064/aacus250064-eq1.gif) (1)
(1)
Here, the index d denotes the direct sound field component rendered by these loudspeakers. The VBAP operator is defined as VBAP(0, φl){⋅}, which maps a virtual source onto a loudspeaker positioned at angle (0, φl). The signals L1, d[n] and L2, d[n] corresponding to the direct sound are convolved with the BRIRs of their respective loudspeakers in the playback room, denoted as BRIRplay, 1[n] and BRIRplay, 2[n], respectively. This process ultimately generates the binaural room-in-room impulse response at the listener’s position for the direct VASs simulated in RAZR.
Before playback, the signals from the two loudspeakers are filtered using a Gammatone filterbank analysis and synthesis [20] to compensate for spectral differences relative to the reference BRIR. This Gammatone filterbank provides a frequency selectivity that closely matches auditory frequency resolution. The impulse response of the i-th Gammatone filter is denoted by γ(i)[n]. The signals of the two front loudspeakers are filtered by the Gammatone filterbank and then convolved with the corresponding BRIR of each LoudSpeaker in the PLayback room (denoted LSPL):
![Mathematical equation: $$ \begin{aligned} \mathrm{LSPL}_{l,d}^{(i)}[n]&= \gamma ^{(i)}[n] * L_{l,d}[n] \nonumber \\&\quad * \mathrm{BRIR}_{l,\mathrm{play}}[n], \quad l=1,2. \end{aligned} $$](/articles/aacus/full_html/2025/01/aacus250064/aacus250064-eq2.gif) (2)
(2)
Here, BRIRl, play denotes the reproduced binaural impulse response of loudspeaker number l on a dummy head in the playback room. Note that any BRIR used in the equations refers to the response at either the left or right ear. The two loudspeaker signals played on a dummy head in the playback room are now arranged into a four-row matrix LSPLd(i).
![Mathematical equation: $$ \begin{aligned} \mathbf LSPL _d^{(i)} = \begin{bmatrix} \mathrm{LSPL}_{1,d}^{(i)}[n]\\[4pt] \mathrm{LSPL}_{2,d}^{(i)}[n]\\[4pt] 0\\[2pt] 0 \end{bmatrix}. \end{aligned} $$](/articles/aacus/full_html/2025/01/aacus250064/aacus250064-eq3.gif) (3)
(3)
We use the matrix notation in equation (3) for its flexibility in selecting any pair of loudspeakers from the four available for direct sound reproduction, even though this study considers only front-facing sources. To control the energy of the reproduced direct sound, we apply a loudspeaker-independent direct-signal gain gd(i) for thei-th Gammatone filter. Taking these gains into account, the reproduced direct sound at the dummy head in the reproduction room is obtained by summing all Gammatone filter signals, each weighted by its corresponding gain:
![Mathematical equation: $$ \begin{aligned} \mathrm{BRinR}_d[n]&= \sum _{i=1}^N g_d^{(i)} \,\mathbf 1 _{1\times 4} \,\mathbf LSPL _d^{(i)} \nonumber \\&\triangleq \sum _{i=1}^N g_d^{(i)} \mathrm{BRinR}_{d,\mathrm{nc}}^{(i)}[n]. \end{aligned} $$](/articles/aacus/full_html/2025/01/aacus250064/aacus250064-eq4.gif) (4)
(4)
Here, N denotes the number of Gammatone filters, and 11 × 4 = [1111]. A new signal  , to be used later, is defined as a non-compensated (indicated by the subscript “nc”) reproduced direct sound at the output of the i-th Gammatone filter. The gains of the Gammatone filters gd(i) are configured such that the energy of the reproduced direct sound in the playback room matches the energy of the simulated direct sound from the reference BRIR generated by RAZR, for each Gammatone filter. The optimization procedure for determining these gains will be described in the nextsubsection.
In the lower path of Figure 1, the compensation and rendering of the reverberant sound is illustrated. The VASs corresponding to the reverberant component are first mapped onto four loudspeakers using a spatial mixing approach. As with the direct sound, this spatial mapping is carried out using the VBAP method. However, the elevation information of the reverberant VASs is discarded, since the loudspeakers are positioned in a horizontal plane. All four loudspeakers are used for rendering the reverberant sound. Each virtual source number c, associated with the reverberant sound VAScrev(αc, Δtc, Θc), similar to the direct sound, is mapped onto two loudspeakers using the VBAP method after omitting its elevation angle of arrival. The reverberant signal assigned to each loudspeaker Ll, r[n] at azimuthal position φl is obtained by summing the contributions of all mapped VASs:
![Mathematical equation: $$ \begin{aligned} L_{l,r}[n]&= \sum _{c=1}^C \mathrm{VBAP}_{(0,\varphi _l)}\mathopen \mathclose {\left\{ \mathrm{VAS}_c^{\mathrm{rev}}\mathopen \mathclose {\left(\alpha _c,\mathrm{\Delta } t_c,\mathrm{\Theta }_c\right)}\right\} }, \nonumber \\&\qquad 1\le l\le 4,\;\varphi _l\in \mathopen \mathclose {\left\{ \pm 45^\circ ,\pm 135^\circ \right\} }. \end{aligned} $$](/articles/aacus/full_html/2025/01/aacus250064/aacus250064-eq6.gif) (5)
(5)
Here, C is the number of VASs, and φl represents the azimuthal positions of the loudspeakers. After this spatial mixing, the signals from the four loudspeakers are filtered using a Gammatone filterbank:
![Mathematical equation: $$ \begin{aligned} \mathrm{LSPL}_{l,r}^{(i)}[n]&= \gamma ^{(i)}[n]*L_{l,r}[n]\nonumber \\&\quad *\mathrm{BRIR}_{l,\mathrm{play}}[n], \quad l=1,2,3,4. \end{aligned} $$](/articles/aacus/full_html/2025/01/aacus250064/aacus250064-eq7.gif) (6)
(6)
Similar to the direct sound in equation (3), the outputs of the four filtered loudspeakers for the reverberant sound are organized into a four-row matrix LSPLr(i):
![Mathematical equation: $$ \begin{aligned} \mathbf LSPL _r^{(i)} = \begin{bmatrix} \mathrm{LSPL}_{1,r}^{(i)}[n]\\[4pt] \mathrm{LSPL}_{2,r}^{(i)}[n]\\[4pt] \mathrm{LSPL}_{3,r}^{(i)}[n]\\[4pt] \mathrm{LSPL}_{4,r}^{(i)}[n] \end{bmatrix}. \end{aligned} $$](/articles/aacus/full_html/2025/01/aacus250064/aacus250064-eq8.gif) (7)
(7)
We define a compensation matrix C(i) for the reverberant sound at the i-th Gammatone band, which is a product of a frequency-dependent energy compensation matrix G(i) and a frequency-dependent and loudspeaker-dependent cross-mixing matrix C M(i):
 (8)
(8)
The C M(i) matrix enables the optimization of interaural cross-correlation at the listener’s ears. This mixing is performed using coefficients α(i) for the two front loudspeakers, and coefficients β(i) for the two rear loudspeakers. The rendering of the reverberant sound differs from that of the direct sound. For the direct sound, the key parameters in rendering are the angle of arrival and spectral coloration, which are addressed using VBAP mapping and energy compensation. In contrast, the rendering of the reverberant sound focuses on optimizing both energy and spatial diffuseness. Spatial diffuseness is controlled using the maximum of the interaural cross-correlation (IACC) function, referred to as interaural coherence (IC), which serves as the optimization metric. This control is achieved through a cross-mixing matrix that combines signals from all four loudspeakers. After cross-mixing, the gains of the Gammatone filters are adjusted so that the energy of the reproduced reverberant sound matches that of the simulated reverberant sound, as represented in the BRIR generated by RAZR. The final rendered binaural room-in-room impulse response for the reverberant sound after compensation is given by:
![Mathematical equation: $$ \begin{aligned} \mathrm{BRinR}_r[n] = \sum _{i=1}^N \mathbf 1 _{1\times 4}\,\mathbf C ^{(i)}\,\mathbf LSPL _r^{(i)}. \end{aligned} $$](/articles/aacus/full_html/2025/01/aacus250064/aacus250064-eq10.gif) (9)
(9)
To determine the mixing coefficients and Gammatone gains for the reverberant sound, a search algorithm is employed to jointly optimize the IC and the reverberant energy. The T60 is also included as an optimization target. It is controlled by adjusting two separation times: one between the direct and reverberant components in the reference BRIRref of the simulated room, denoted as Tref, and another used to divide the BRinRd[n] in equation (4) into direct and reverb parts, denoted as Tplay. The detailed optimization procedures for both the direct and reverberant components are presented in the next subsection.
2.2 Optimization
In this subsection, the optimization procedures for the reproduction method are presented in detail. Figure 2 presents a block diagram illustrating the optimization process implemented in the proposed ART system.
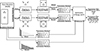 |
Figure 2 Block diagram of the optimization process for the ART system with four loudspeakers. The upper outputs from the RAZR room simulation are used in the reproduction chain, which includes mapping the simulated virtual sources onto four loudspeakers, convolving the loudspeaker signals with their respective BRIRs in the playback room, and applying Gammatone filtering. The lower output from RAZR is the binaurally simulated room used as a reference signal (BRIRref). For simplicity, only the BRIRref corresponding to one ear is depicted. The direct and reverberant components of BRIRref are separated at time Tref, and Gammatone filtering is applied in the same manner as for the upper outputs. As shown in the upper part of the figure, the direct signal is rendered using the two front loudspeakers, while the reverberant signal is rendered using all four. The Gammatone filterbank outputs of the rendered binaural room-in-room impulse responses (BRinR) and the BRIRref are then compared to optimize the energy of the direct sound using gd(i) gains, and the energy of the reverberant sound as well as the interaural coherence (IC) of the rendered BRinR using gr(i) gains and cross-mixing coefficients α(i) and β(i). |
For the optimization, the simulated BRIRref in RAZR is used as the reference signal. The BRIRref can be divided into direct BRIRref, d and reverberant BRIRref, r components using a reference separation time Tref (see lower half of Fig. 2):
![Mathematical equation: $$ \begin{aligned} \mathrm{BRIR}_{\mathrm{ref} }[n] = \mathrm{BRIR}_{\mathrm{ref} ,d}[n] + \mathrm{BRIR}_{\mathrm{ref} ,r}[n]. \end{aligned} $$](/articles/aacus/full_html/2025/01/aacus250064/aacus250064-eq11.gif) (10)
(10)
The direct part is used in the optimization to ensure accurate spectral coloration and directional properties, while the reverberant part is used to ensure proper spectralcoloration and spatial diffuseness. The optimization procedure adjusts the frequency-dependent gains of the reproduced direct and reverberant sounds. This is achieved using the Gammatone filterbank outputs of the simulated BRIRref and the reproduced BRinR. In this study, a Gammatone filterbank with 42 channels was used, each with a bandwidth corresponding to the Equivalent Rectangular Bandwidth (ERB) [21]. The center frequencies of the filters were uniformly spaced on the ERB-rate scale. The spectral resolution employed in the optimization is designed to align with the frequency selectivity of the human auditory system. Two criteria used in the optimization are frequency-dependent energy, and interaural coherence (IC). The optimization is performed in two stages: first, the energy of the direct sound is optimized, followed by a joint optimization of the reverberant sound energy and IC. The simulated BRIR generated by RAZR assumes the same dummy head as the one used in the playback room (see upper part of Fig. 2). It is also important to note that the separation time between the direct and reverberant components of BRIRref, denoted as Tref, plays a critical role in the ART method, as it indirectly influences the direct-to-reverberant ratio, which is a perceptually relevant property of the sound field. This parameter is determined empirically through informal listening tests.
2.2.1 Optimization of direct sound
For the optimization of the direct sound, the entire processing and rendering chain of the direct sound field component generated by RAZR is considered (see Eq. (4)) and considering the optimization criteria, it is adjusted to closely match the direct sound in the simulated reference BRIR shown in equation (10). The non-compensated reproduced direct sound  in equation (4) can be separated into the direct
  and reverberant
  components. Accordingly, equation (4) can be rewritten as follows:
![Mathematical equation: $$ \begin{aligned} \mathrm{BRinR}_d[n]&\triangleq \sum _{i=1}^N g_d^{(i)} \mathrm{BRinR}_{d,\mathrm{nc}}^{(i)}[n] \nonumber \\&= \sum _{i=1}^N g_d^{(i)} \mathrm{BRinR}_{d,\mathrm{nc},d}^{(i)}[n] \nonumber \\&\quad + \sum _{i=1}^N g_d^{(i)} \mathrm{BRinR}_{d,\mathrm{nc},r}^{(i)}[n]. \end{aligned} $$](/articles/aacus/full_html/2025/01/aacus250064/aacus250064-eq15.gif) (11)
(11)
Note that the reverberant part  is generated by the natural reverberation of the playback room in response to the direct-sound loudspeakers. The separation time between
  and
and  is denoted by Tplay, and for simplicity, it is considered frequency-independent in this study. The proper selections of Tref in equation (10) and Tplay in equation (11) play an important role in the optimization procedure, as these parameters directly affect the quality of the reproduced direct and reverberant sounds, and consequently, the direct-to-reverberant ratio of the reproduced sound field. The effects of these two parameters will be thoroughly investigated in the next section. To ensure a perceptually relevant spectral resolution during the optimization process, the Auditory Transfer Function (ATF(i)) is employed. It is defined as the energy in the output of the i-th Gammatone filter and can be expressed as:
![Mathematical equation: $$ \begin{aligned} \mathrm{ATF}^{(i)}\{h[n]\} = \sum _{n=0}^{\infty } \mathopen \mathclose {\left| \gamma ^{(i)}[n] * h[n] \right|}^2. \end{aligned} $$](/articles/aacus/full_html/2025/01/aacus250064/aacus250064-eq19.gif) (12)
(12)
The first step is the compensation of direct sound  in equation (11). For frequency-dependent energy equalization of direct sound, the i-th Gammatone filterbank gain gd(i) is determined such that energy of the reproduced direct signal in equation (11) matches that of the direct reference signal in equation (10):
![Mathematical equation: $$ \begin{aligned}&\mathrm{ATF}^{(i)}\{\mathrm{BRIR}_{\mathrm{ref},d}[n]\} \nonumber \\&\qquad = \mathopen \mathclose {\left(g_d^{(i)}\right)}^2 \mathrm{ATF}^{(i)}\mathopen \mathclose {\left\{ \mathrm{BRinR}_{d,\mathrm{nc},d}^{(i)}[n]\right\} }. \end{aligned} $$](/articles/aacus/full_html/2025/01/aacus250064/aacus250064-eq21.gif) (13)
(13)
Here, gd(i) is assigned as the gain for loudspeakers one and two in the i-th Gammatone band. The gain optimization method proposed in [22] is used, taking into account the effect of overlapping filters, such as occur in a Gammatone filterbank. It should be noted that separate gains are obtained for the left and right ears, and a weighted average of these values is ultimately used as the loudspeaker gain for reproducing the direct sound. After calculating and applying the Gammatone gains to loudspeakers one and two, the energy-compensated reproduced direct sound in equation (11) can be rewritten as follows:
![Mathematical equation: $$ \begin{aligned} \mathrm{BRinR}_d[n]&= \sum _{i=1}^N g_d^{(i)} \mathbf 1 _{1\times 4}\,\mathbf LSPL _d^{(i)} \nonumber \\&= \mathrm{BRinR}_{d,d}[n] + \mathrm{BRinR}_{d,r}[n]. \end{aligned} $$](/articles/aacus/full_html/2025/01/aacus250064/aacus250064-eq22.gif) (14)
(14)
A separation time Tplay is used to divide BRinRd[n] into the direct BRinRd, d[n] and reverberant BRinRd, r[n] components. The BRinRd, r represents the reverberant sound reproduced by the direct-sound loudspeakers, which must be taken into account in the optimization of the total reproduced reverberant sound, as described in the next subsection.
2.2.2 Joint optimization of reverberant sound and interaural coherence
After the compensation of the direct sound, the reverberant sound is addressed. The optimization of the reverberant energy is performed jointly with the interaural coherence (IC) optimization of the entire reproduced signal. It is important to note that the reverberant sound received by the listener in the room with four loudspeakers consists of two components: the mapped simulated reverberation convolved with the corresponding playback loudspeakers (BRinRr[n] in Eq. (9)), and the mapped direct sound convolved with the BRIRs of the two front loudspeakers after Gammatone filtering for the direct sound (BRinRd, r[n] in Eq. (14)):
![Mathematical equation: $$ \begin{aligned} \mathrm{BRinR}_{\mathrm{total},r}[n]&= \mathrm{BRinR}_{d,r}[n] + \mathrm{BRinR}_r[n] \\&= \mathrm{BRinR}_{d,r}[n] + \sum _{i=1}^N \mathbf 1 _{1\times 4}\,\mathbf C ^{(i)}\,\mathbf LSPL _r^{(i)}. \nonumber \end{aligned} $$](/articles/aacus/full_html/2025/01/aacus250064/aacus250064-eq23.gif) (15)
(15)
The term BRinRd, r[n] from equation (14) is included because the compensated direct sound played through the front loudspeakers also generates reverberation due to the playback room acoustics, which is not considered for in the optimization of the direct sound. This is why the T60 of the simulated room should be higher than, or at most close to that of the playback room, so that the reverberation produced by the direct sound BRinRd, r[n] has low energy, allowing additional reverberant signal from the simulated room BRinRr[n] to be effectively added. For the optimization of reverberant sound, a combination of (α(i), β(i)) in cross-mixing matrix C
M(i) in equation (8) is first determined, followed by compensation of the reverberant energy. The coefficients (α(i), β(i)) are obtained using a grid search algorithm over a range of predetermined values, for example −2 ≤ α(i), β(i) ≤ 2 with a step size of 0.1. A cross-mixed reverberant signal  in each frequency band is then compensated using its corresponding Gammatone gain gr(i), such that the ATF of the total reverberant signal matches that of the reference reverberant signal in equation (10):
![Mathematical equation: $$ \begin{aligned}&\mathrm{ATF}^{(i)}\mathopen \mathclose {\left\{ \mathrm{BRIR}_{\mathrm{ref},r}[n]\right\} } = \mathrm{ATF}^{(i)}\mathopen \mathclose {\left\{ \mathrm{BRinR}_r[n]\right\} } \nonumber \\&\qquad + \mathopen \mathclose {\left(g_r^{(i)}\right)}^2 \mathrm{ATF}^{(i)}\mathopen \mathclose {\left\{ \mathbf 1 _{1\times 4}\,\mathbf CM ^{(i)}\,\mathbf L _r^{(i)}\right\} }. \end{aligned} $$](/articles/aacus/full_html/2025/01/aacus250064/aacus250064-eq25.gif) (16)
(16)
In this optimization, it is assumed that the two reverberant signals BRinRr(i)[n] and  in equation (16) are uncorrelated [16]. After obtaining theGammatone gains gd(i) for the direct sound, assigning the cross-mixing coefficients (α(i), β(i)), and finally determining the Gammatone gains gr(i) for the reverberant sound, a total compensated BRinR in the i-th Gammatone band is obtained as the sum of the compensated direct signal from equation (4) and compensated reverberant signal from equation (9):
![Mathematical equation: $$ \begin{aligned} \mathrm{BRinR}^{(i)}[n] = \mathrm{BRinR}_d^{(i)}[n] + \mathrm{BRinR}_r^{(i)}[n]. \end{aligned} $$](/articles/aacus/full_html/2025/01/aacus250064/aacus250064-eq27.gif) (17)
(17)
In this step, the IACC function and the resulting IC between the left and right ears are evaluated after applying cross-mixing and energy compensation:
![Mathematical equation: $$ \begin{aligned} \mathrm{IACC}^{(i)}[q]&= \frac{\sum _m \mathrm{BRinR}_{\rm left}^{(i)}[m]\,\mathrm{BRinR}_{\rm right}^{(i)}[m+q]}{\sqrt{\sum _m \mathopen \mathclose {\left(\mathrm{BRinR}_{\rm left}^{(i)}[m]\right)}^2}\!\sqrt{\sum _m \mathopen \mathclose {\left(\mathrm{BRinR}_{\rm right}^{(i)}[m]\right)}^2}} \nonumber \\ \mathrm{IC}^{(i)}&= \max _q \mathrm{IACC}^{(i)}[q]. \end{aligned} $$](/articles/aacus/full_html/2025/01/aacus250064/aacus250064-eq28.gif) (18)
(18)
For each frequency band, this IC(i) is compared with the reference IC, denoted as  . The
. The  is calculated as the IC between signals
 ![Mathematical equation: $ \mathrm{BRIR}_{\mathrm{ref,left}}^{(i)}[n] $](/articles/aacus/full_html/2025/01/aacus250064/aacus250064-eq31.gif) and
and ![Mathematical equation: $ \mathrm{BRIR}_{\mathrm{ref,right}}^{(i)}[n] $](/articles/aacus/full_html/2025/01/aacus250064/aacus250064-eq32.gif) from the reference signal in equation (10). The error value in each frequency band is denoted as
from the reference signal in equation (10). The error value in each frequency band is denoted as  . To find the optimal values for α(i) and β(i), a search procedure repeatedly performs the optimization using equations (16)–(18). The values of α(i) and β(i) that correspond to the minimum
  , along with the associated gr(i), are selected as the final cross-mixing coefficients and Gammatone gains for that frequency band.
2.3 ART filtering
After the optimization has been completed, the resulting parameters can be used to render sound sources through a time-invariant filtering and mixing step, where the source signal is processed using a set of perceptually-based filters. At this stage, no BRIRs are used in thesignal path. A block diagram of the ART filtering using the obtained energy-compensation coefficients gd(i) and gr(i), and cross-mixing coefficient α(i) and β(i) is depicted in Figure 3. This diagram highlights only the essential signal processing steps already presented in Figure 1. The VBAP mappings for the separated direct and reverberant sounds are the same as those used in the optimization step. For the direct sound, the signals mapped onto the two front loudspeakers are filtered using the Gammatone gains gd(i). For the reverberant sound in each Gammatone band, the cross-mixing coefficients α(i) are applied to combine the signals from the front loudspeakers, while separate coefficients β(i) are used for combining the rear loudspeaker signals. Following this cross-mixing step, the gains gr(i) defined in equation (8) are assigned to the resulting signals from all four loudspeakers.
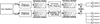 |
Figure 3 Block diagram of ART filtering: After VBAP mapping of simulated direct and reverberant signals, both components are processed through the analysis and synthesis framework of a Gammatone filterbank. For the direct sound, energy-compensation gains gd(i) are applied, while for the reverberant sound, cross-mixing coefficients α(i) and β(i), along with gains gr(i), are used. For each loudspeaker, the direct and reverberant signals are combined and then convolved with an audio file before playback. |
The non-compensated direct and reverberant loudspeaker signals, arranged in four-column matrices Ld(i) and Lr(i) respectively, for Gammatone band i, after applying the gains and cross-mixing coefficients are added together as follows:
 (19)
(19)
The final compensated signals for the loudspeakers are obtained by applying Gammatone synthesis to the total signals:
 (20)
(20)
Finally, each loudspeaker signal is convolved with an audio file before playback.
3 Objective evaluation
3.1 Simulated and playback rooms
Two simulated rooms in RAZR [4], referred to as Room1 and Room2, are used for evaluation of the proposed method. The reverberation times at mid frequencies (averaged over 500, 1000, and 2000 Hz) of Room1 and Room2 are T30, room1 = 0.56 s and T30, room2 = 1.60 s, respectively. In the simulated scenarios, it is assumed that the direct sound originates from the front-right direction (azimuth of 30°). The reproduction setup is shown in Figure 4.
 |
Figure 4 Playback room setup, including four loudspeakers positioned at azimuth angles of 45°, −45°, 135° and −135°. The T30 of the room is 0.50 s. |
The azimuth positions of the loudspeakers, relative to the KEMAR dummy head placed at the center of the room, are 45°, −45°, 135° and −135°. The reverberation time of the playback room is approximately T30, playback = 0.50 s. Figure 5 illustrates the reverberation times in 1/3-octave bands for the two simulated rooms and the playback room.
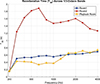 |
Figure 5 Reverberation times in 1/3-octave bands for the two simulated rooms (Room1 and Room2) and the playback room. |
While Room2 provides sufficient contrast to the playback room for reverberation control, Room1 has a reverberation time close to that of the playback room,particularly in the mid and high frequencies. This overlap limits the system’s ability to enhance or shape reverberation perceptually and highlights a key constraint when rendering low-reverberation scenes in moderately reverberant playback environments. For this reason, including Room1 in our listening tests allows us to critically evaluate our method at the boundary of itsapplicability.
The direct sound output from RAZR is mapped onto the two front loudspeakers, labeled as loudspeaker one and loudspeaker two in Figure 4. For the reverberant component, all four loudspeakers are used. We have chosen the 30° azimuth direction to also evaluate the flexibility of our approach under phantom-source direct rendering conditions, where none of the loudspeakers are positioned at the direction of the direct sound. In our approach, the BRIRs need to be recorded only once, and it is sufficient to optimize only for the newly simulated room in RAZR. It should be noted that in phantom-source positioning, even for the most challenging case where the phantom source must be created midway between two loudspeakers, the perceptual limitations are partially mitigated by the presence of the reverberant sound field (cf. [23, 24]). In clinical settings, it would likely be feasible to place a real loudspeaker at the position corresponding to the direct sound. The recorded BRIRs of the four loudspeakers in the playback room, along with the simulated RIRs and BRIR, are used together in the optimization process. In this procedure, four combinations of separation times between the direct and reverberant components, as defined in equations (10) and (11), are selected. These combinations are presented inTable 1.
These separation times primarily control the direct-to-reverberant ratio and also influence the resulting reverberation time. The highest direct-to-reverberant ratio corresponds to processed case number one (P1 in Tab. 1), where (Tref, Tplay)=(13, 13) ms, while the lowest ratio corresponds to processed case number four (P4), with (Tref, Tplay)=(13, 40) ms. The P1 case has the largest, and the P4 case has the smallest direct sound gains gd(i). Therefore, in the P4 case, the reverberant component of the RinR impulse response, reproduced by the front loudspeakers (BRinRd, r in Eq. (14)), has the lowest energy among all cases. As a result, the smaller direct sound gains allow for adding more simulated reverberant sound using higher reverberant gains gr(i). It should be mentioned that these separation times were empirically selected based on informal listening experiments.
3.2 Evaluation of direct and reverb gains
The direct and reverberant gains obtained through optimization, along with the Auditory Transfer Functions (ATFs) of the processed reverberant BRIRs (P1, P2, P3, and P4) in Room1 for the left and right ears, are shown in Figure 6. The upper two panels show the Gammatone filterbank gains obtained through optimization for the direct and reverberant components, with gd(i) in the upper-left panel and gr(i) in the upper-right panels, respectively. The obtained gains in the low-frequency range are higher for the P1 case and lower for the P4 case. This observation aligns with expectations, as for the P4 case, a larger portion of BRinRd[n] in equation (14) is assigned to the reproduced direct part (BRinRd, d[n]) that is compared with the direct part of the reference BRIRref, d[n], as outlined in equation (10). Consequently, lower gains are required for compensating the energy in the P4 case.
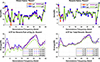 |
Figure 6 The upper-left and upper-right panels illustrate the gains of the Gammatone filterbank in Room1 for the direct and reverb parts, respectively. The lower-left panel displays the ATF of the compensated direct sound contributed as the reverb part, and the lower-right panel shows the ATF of the total reproduced reverb signal. According to the lower-right panel, in the low frequencies only a marginal increase in decibels is added to the P1 and P2 cases as the reverberant sound. For the P3 case, approximately 5 dB, and for the P4 case, approximately 10 dB are added, indicating a greater potential for incorporating reverberation in these two cases. |
According to equation (15), a portion of the direct sound contributes to the reverberant component, which is reproduced by the two front loudspeakers, numbered one and two. The lower-left panel of Figure 6 displays the ATFs of the compensated direct BRIR contributed as the reverb part (BRinRd, r[n] in Eq. (15)), while the lower-right panel illustrates the total reproduced reverb BRIR (BRinRtotal, r[n] in Eq. (15)). By comparing the two lower panels of Figure 6, it can be observed that in the low-frequency range, where the reverberant sound is dominant, the P1 and P2 cases offer limited capacity for adding additional reverberation to the signal.
Specifically, only a marginal increase in total reverberant energy at low frequencies is evident for P1 and P2. In contrast, the P3 case shows an increase of approximately 5 dB, and the P4 case shows an increase of about 10 dB in the reverberant component, as compared to the reverberation reproduced by the direct loudspeakers. The direct and reverberant gains obtained for Room2 are shown in Figure 7. Similar to Room1 in Figure 6, Room2 demonstrates a greater capacity to incorporate additional reverberant energy into the final signal in the P3 and P4 cases. It is evident that only a minimal amount of additional reverberation is added in the P1 and P2 cases. In contrast, the P3 case shows a modest increase of a few decibels, while the P4 case exhibits more than 10 dB of added reverberant energy.
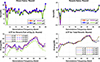 |
Figure 7 Similar to Figure 6, but showing the data for Room2. As with Room1, the P3 and P4 cases exhibit lower direct gains compared to P1 and P2, indicating a greater potential to incorporate additional reverberant sound into the final signal. |
3.3 Optimization results
The results of optimization for the reproduced BRIRs in Room1 are depicted in Figure 8. Room1 has a T60 value very close to that of the playback room. The two upper panels of Figure 8 display the ATFs of BRinR(i)[n] in equation (17) for left and right ears. In these panels, the ATFs of four processed BRIR versions (P1, P2, P3, and P4) are compared with those of the simulated reference (Ref), which is the ideal BRIR generated by RAZR for headphone playback, and the unprocessed (UnP) case, where the VASs from RAZR are simply mapped to the loudspeakers without any additional processing. Some mismatches between the total compensated and reference BRIRs are still visible in the two upper panels of Figure 8 as energy compensation is performed separately for the direct and reverberant components rather than for their combined total. Note that for the UnP case, the reverberation of the playback room leads to an increase in energy, specifically in the low-frequency range. The ATFs of the processed P3 and P4 cases show a better match to the reference (Ref) compared to the UnP case across most of the Gammatone filters. In the lower frequency bands, where reverberation dominates (e.g., bands three and four), the P1 and P2 cases do not achieve effective compensation. This is due to the very similar T60 values of the simulated and playback rooms, where, according to equation (11), the direct sound in the playback room generates a reverberant field that can no longer be effectively controlled by simply adding more simulated reverberation. In contrast, for the P3 case, and especially for P4, good compensation of total energy in the low-frequency range is observed. Despite the good energy matching observed in the P3 and P4 cases, there remains a possibility of producing an incorrect direct-to-reverberant ratio, which may reduce similarity to the reference signal.To more effectively assess how these factors influence perception, a listening test that was conducted will be presented in the next section.
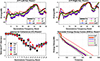 |
Figure 8 Comparisons of four processed versions of the ART method (P1, P2, P3, P4) with the reference (Ref) and the unprocessed (UnP) BRIRs in Room1. The two upper panels show the ATFs of BRIRs for Ref, UnP and processed BRIRs for the right and left ears. The lower-left panel illustrates the Interaural Coherence (IC) of the processed and UnP cases, along with their comparison to the reference BRIR for perceptually relevant frequencies below 1500 Hz. The lower-right panel shows the Schroeder energy decay curves (EDCs) of the BRIRs. |
In the lower-left panel of Figure 8, the ICs of the processed and unprocessed BRIRs are compared to those of the reference signal across frequency bands up to band number 19. These bands are perceptually most relevant for IC, as the auditory system is particularly sensitive to changes in interaural coherence below 1500 Hz. Some improvement in IC is observed in specific bands, particularly in bands 12 and 13. However, for most frequency bands, no significant changes in IC are observed, which is again attributed to the very similar T60 values of the simulated and playback rooms. The lower-right panel shows the Schroeder energy decay curves (EDCs) [25] of the Ref, processed and UnP cases. As can be observed, the ART method significantly improves the match in T60 between the simulated and reproduced environments. Compared to the unprocessed (UnP) case, the EDCs of processed BRIRs are improved and are very close to that of the Ref case. The EDCs of P1 and P2 cases, in comparison to P3 and P4 cases, show a better match to that of the reference BRIR. For the P1 and P2 cases, a lower amount of reverb sound is added to the direct sound, and therefore the reverberation tail is shorter.
The ATFs of left and right ears, the ICs and EDCs for Room2 are illustrated in Figure 9. The simulated Room2 has a higher T60 than the playback room. Compared to Room1, there is a better match between the processed and the reference BRIRs for ATFs for both ears, as well as the ICs across the entire frequency range. Specifically, as shown in the upper panels of Figures 8 and 9, all processed cases in Room2 exhibit better compensation in the low-frequency range compared to those in Room1. When the T60 of the simulated room is considerably longer than that of the playback room, as in Room2, controlling reverberation in the playback room becomes easier by adding more reverberant energy from the simulated room.Furthermore, according to the lower-left panel of Figure 9, the IC values of processed cases in Room2 show a much closer match to those of Ref across the entire frequency range compared to Room1.
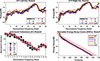 |
Figure 9 The ATFs for the left and right ears, ICs, and EDCs are shown for Room2. Compared to Room1, the ATFs and ICs of the processed BRIRs in Room2 exhibit a better match to those of the reference case, particularly in the low-frequency bands. Additionally, the lower-right panel illustrates improvements in the EDC and T60 of the processed cases compared to the UnP case. |
4 Listening experiments
For the quality evaluation of the ART method, a multi-stimulus scaling experiment similar to the MUSHRA test [26], referred to as a MUSHRA-like test, was conducted with 13 listeners using headphones. Evaluation over headphones provides a critical approach to evaluate the effectiveness of the system. In the case of a limited number of loudspeakers placed in a reverberant environment, reproduction does not introduce spatial artifacts. We interpret this as likely being related to the observations made by Wierstorf et al. [23], who reported that perceptible coloration artifacts are minimal in two-channel sound reproduction, which corresponds to our panning approach for the direct sound. Furthermore, previous work using a similar approach [16] demonstrated robustness to changes in listener position relative to the one used during optimization.
The signals used in this experiment include an ideally simulated reference signal with RAZR, also used as hidden reference (Ref), a compensated direct signal played from the front loudspeakers (Dir), reproduced direct and reverb signals in the playback room without processing (UnP), the BRIR measured by a real KEMAR (Real) in the two real rooms, and four versions of processed signals produced by our ART method (P1, P2, P3 and P4). The Real condition refers to binaural recordings made with a KEMAR dummy head physically placed in the actual Room1 and Room2. The real rooms served as the basis for the RAZR simulations. The Real condition is not part of the ART processing evaluation, but serves as an auxiliary condition to compare the simulated room acoustics (Ref) against real acoustic environments. Including this condition provides insight into the accuracy of room simulation using RAZR, which is being continuously improved by our collaborators. The Dir, UnP and processed signals (P1, P2, P3 and P4) were played back using the loudspeakers in the reproduction room and recorded with the same dummy head used to generate the reference (Ref) signal in the RAZR simulation. For each room, short audio files were used, including one male voice and five musical instruments: guitar, clarinet, piano, snare drum, and trumpet. In the listening test, subjects were instructed to assign a score of 100% to the hidden reference. The direct (Dir) signal served as an anchor, similar to the role of the anchor in a standard MUSHRA test.The tests were conducted in three sessions, evaluating general-quality similarity, timbral similarity, and spatial similarity to the reference sound. The results of the listening tests are presented below.
4.1 Evaluation of general similarity
The results of the first listening test, in which the general similarity to the reference signal was evaluated, are shown in Figure 10. The mean scores and standard errors for each instrument were calculated by averaging across the 13 subjects who participated in the experiment. These results are presented in the upper-left and upper-right panels of the figure for Room1 and Room2, respectively. In Room1, all instruments show an increase in mean scores for the processed cases (P1, P2, P3, and P4) compared to the unprocessed (UnP) case. A similar improvement is observed in Room2, where the processed cases also outperform the UnP case. However, the scores for the clarinet and piano in the processed conditions are only slightly higher than those of the UnP case.
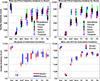 |
Figure 10 Results of the listening test evaluating general-quality similarity in two rooms. The mean scores and standard errors averaged across 13 subjects for each instrument in Room1 and Room2 are shown in the upper panels. In Room1, clear improvements are observed for all instruments when comparing processed cases (P1–P4) to unprocessed (UnP) signals. In Room2, improvements are also observed, except for the clarinet and piano. The lower-left panel displays boxplots showing variation across instruments, with medians, 25th and 75th percentiles, and outliers. The lower-right panel shows mean and standard errors across all instruments. |
The limited improvement in reverberation compensation may be primarily attributed to the spectral characteristics of the clarinet and the selected piano excerpts. The clarinet concentrates most of its energy in the high-frequency range, which is less responsive to the benefits of reverberation compensation. The snare drum has the most impulsive time-domain pattern among all instruments, resulting in the widest frequency spectrum. Therefore, its listening test results provide a clearer indication of the effectiveness of the ART system in improving signal quality.
For statistical analysis, a two-tailed t-test with a 95% confidence level was used to evaluate the effects of the ART method, as well as the impact of different separation times (Tplay) as listed in Table 1 on subject variability. For the snare drum in Room1, the differences between P1 and UnP cases (t(24)=1.41, p = 0.1707) and between P4 and UnP cases (t(24)=1.82, p = 0.08) are not statistically significant. However, the differences between P2 and UnP cases (t(24)=2.31, p < 0.05) and between P3 and UnP cases (t(24)=3.83, p < 0.001) are statistically significant. These results highlight the importance of selecting an appropriate Tplay in equation (11) for effective optimization. For the processed cases, the difference between P3 and P2 is not significant (t(24)=1.28, p = 0.21), but the differences between P3 and P1 (t(24)=2.21, p < 0.05) and between P3 and P4 (t(24)=2.23, p < 0.05) are significant. For the snare drum in Room2, the difference between the P2 case, which has the lowest mean score, and the UnP case is statistically significant (t(24)=2.16, p < 0.05). For the snare drum in Room2, the difference between the P2 case, which has the lowest the mean score, and the UnP case is statistically significant (t(24)=2.16, p < 0.05). Among the processed cases, only the difference between P1 and P4 is significant (t(24)=2.10, p < 0.05).
In the lower-left panel of Figure 10, the variations across instruments are illustrated. Median values are shown along with the 25th and 75th percentiles, as well as outliers, across the six audio samples (five instruments and one speech sample). The mean and standard errors (STD) of these data are presented in the lower-right panel of Figure 10. Reproduction of the direct sound only (Dir) results in a noticeable perceived degradation in signal quality compared to the reference signal. The unprocessed case (UnP), which includes direct and reverb sound, shows strong improvement compared to only direct reproduction, but still has degraded quality compared to the reference signals.
For both rooms, all processed signals (P1–P4) received higher scores than the UnP and the real KEMAR (Real) cases. The highest average scores in Room1 and Room2 were achieved with the P3 and P1 conditions, respectively, showing improvements of more than 35% and 30% in ART rendering compared to the uncompensated case. A two-tailed t-test with a 95% confidence level was used to evaluate the effects of instrument variability. For all instruments in Room1, the difference between P1 (lowest mean value) and UnP is significant (t(10)=5.39, p < 0.001). For the processed cases in Room1, the difference between P3 (highest mean value) and P1 (lowest mean value) is not significant (t(10)=1.69, p = 0.12). For all instruments in Room2, the difference between P4 (lowest mean value) and UnP is significant (t(10)=3.06, p < 0.01). For the processed cases in Room2, only the difference between P1 and P4 is significant (t(10)=2.35, p < 0.05). The mean and STD for instrument variations are consistent with the snare drum results, showing the best average scores for P3 in Room1 and P1 in Room2. Statistical analysis confirms significant improvements for several conditions. These results highlight the importance of selecting appropriate Tplay in equation (11) for effective optimization.
4.2 Evaluation of timbre similarity
The second headphone evaluation focused on spectral or timbral similarity. According to ITU-R Recommendation BS.2399-0 [27], a more precise term for this type of evaluation is Full, which refers to the overall spectral content, including both low- and high-frequency components. For this experiment, the signal from the right ear was presented diotically to both ears, thereby eliminating spatial information from the audio stimuli. In the MUSHRA-like test, listeners were asked to assess the Full proximity of each stimulus to the reference sound. The results from 13 participants are shown in Figure 11.
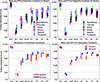 |
Figure 11 Timbre-similarity scores. Results are similar to those in Figure 10, but now focusing on timbre. For Room1, the P3 case generally scores highest. For Room2, the processed P3 and P4 cases show higher mean values than P1, which contrasts with the general similarity results. |
The upper two panels display the mean scores and standard errors for the evaluated audio stimuli. For Room1, the highest mean score for the snare drum is associated with the P3 case, while the lowest mean score corresponds to the P1 case. A significant difference is observed between the P1 and UnP cases (t(24)=2.17, p < 0.05). However, the P3 case, which has the highest mean value, and the P1 case, which has the lowest mean value, do not show a significant difference (t(24)=1.23, p = 0.23). For Room2, the highest mean score for the snare drum is associated with the P1 case, while the lowest mean score corresponds to the P4 case. The P4 and UnP cases show a significant difference (t(24)=4.24, p < 0.05). There is no significant difference between the processed P1 and P4 cases (t(24)=1.46, p = 0.15). Unlike the results related to Figure 10, which presented the general similarity assessment, no statistically significant differences were observed between the processed cases of the snare drum with respect to timbral similarity.
For all instruments in Room1, the P3 case shows the highest mean values, while the P2 case shows the lowest. The difference between P2 and UnP cases is significant (t(10)=2.86, p < 0.05). There is no significant difference between the processed P3 and P2 cases (t(10)=1.32, p = 0.21). For Room2, the P2 and P3 cases show higher mean values than the P1 case. This contrasts with the results of the quality assessments in Figure 10, where the P1 case had the highest mean score. The difference between the P4 case, which has the lowest mean value among the processed cases, and the UnP case is statistically significant (t(10)=4.24, p < 0.05). The differences between the P2 and P3 cases (t(10)=0.10, p = 0.91) and between the P2 and P1 cases (t(10)=0.90, p = 0.38) are not significant. However, the difference between the P2 and P4 cases is significant (t(10)=2.40, p < 0.05).
4.3 Evaluation of spatial similarity
In the third headphone experiment, spatial similarity to the reference was rated. Participants were instructed to focus on attributes such as “source width” and “envelopment” [27]. Presumably, “source width” is primarily associated with the direct component of the signal, while “envelopment” is mainly influenced by the reverberant component. The spatial similarity scores are presented in Figure 12, following the same format as in Figures 10 and 11.
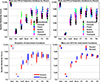 |
Figure 12 Spatial similarity scores (source width and envelopment) relative to the reference. Results are presented in the same format as Figures 10 and 11. For Room1, P1 achieved the highest mean score for the snare drum. For Room2, results were consistent with earlier tests, with P1 again performing best. |
For the snare drum in Room1, unlike in Figures 10 and 11, the P1 case shows the highest mean value. The lowest mean value is observed for the P4 case, and its difference from the UnP case is statistically significant (t(24)=3.57, p < 0.05). Among the processed cases, the difference between the P1 and P2 cases is statistically significant (t(24)=2.08, p < 0.05), whereas the differences between P1 and P3 (t(24)=0.88, p = 0.39) and between P1 and P4 (t(24)=0.90, p = 0.37) are not significant.
For the snare drum in Room2, the P4 case has the lowest mean value, and its difference from the UnP case is not statistically significant (t(24)=1.02, p = 0.31). This indicates that selecting a long Tplay in equation (11) is not suitable for Room2. However, the P2 case, which has the second lowest mean value, shows a statistically significant difference from the UnP case (t(24)=2.26, p < 0.05). Among the processed cases in Room2, only the P1 and P4 cases show a statistically significant difference (t(24)=2.13, p < 0.05).
For the instrument variations shown in the lower panels of Figure 12, the lowest mean score in Room1 is associated with the P2 case, which shows a statistically significant difference from the UnP case (t(10)=2.97, p < 0.05). There is no significant difference between the processed cases in Room1. In Room2, the lowest mean score is associated with the P4 case, and the difference between the P4 and UnP cases is statistically significant (t(10)=4.43, p < 0.05). Among the processed cases, the highest and lowest mean values are associated with the P1 and P4 cases, respectively. However, the difference between P1 and P4 is not statistically significant (t(10)=0.90, p = 0.38).
5 Discussion and summary
In this study, we showed that with appropriate compensation methods, and provided that source and receiver are placed in the same plane, it is possible to render a virtual acoustic environment over a limited number of loudspeakers placed within a reverberant environment with good similarity to a full rendering over headphones. This has relevance for clinical applications where it can be desirable to evaluate hearing abilities in reverberant environments in a standardized manner, including playback over loudspeakers.
In our method for spatial reproduction of simulated scenes, such as those created with tools such as RAZR [4, 6], four loudspeakers are used to render perceptually compensated audio, reducing the influence of the acoustics of the playback room. The simulated direct and reverberant sounds are separately mapped to the positions of four loudspeakers using the Vector Base Amplitude Panning (VBAP) method. It is important to note that, due to the horizontal arrangement of the loudspeakers, elevation angles of reflections are not represented in the VBAP mapping. Fortunately, some of the elevation information in the reverberant sound field is partially recreated through the natural reverberation of the playback room itself. Instead of perfectly reconstructing thesimulated sound field, the approach aims to accurately reproduce the directional cues, energy, and interaural coherence (IC) of the sounds to closely match the simulated reference signal. For achieving perceptual similarity, these cues have been shown to be highly important, as demonstrated in parametric spatial audio coding approaches that represent the spatial sound field with very high perceptual similarity using only directional cues, ITDs, ILDs, and IC cues [28].
Since in the current approach we rely on phantom source creation, similar constraints on sweet spot position and head orientation apply as in normal stereo playback. In future research towards clinical applications of this method, it will be important to investigate speech intelligibility in different spatial configurations, with spatially collocated and separated speakers, to assess whether highly similar intelligibility results are obtained independent of playback room. In addition, it is expected that when wearing hearing aids with beamforming algorithms it will be required that, in the playback room, direct sound-field components of virtual sources are rendered by a physical loudspeaker instead of by a phantom source. Within the context of clinical standardized tests such a constraint seems very reasonable.
The direct component of the reference signal is reproduced using two front loudspeakers aligned with the direction of arrival (DOA) of the direct sound in the simulated room, and is filtered using Gammatone gains to compensate for coloration effects introduced by the reproduction room. For the reverberant component, spatial distortions related to the perceived diffuseness of the sound, along with additional coloration caused by the room, are addressed by cross-mixing the signals from the two front and two rear loudspeakers, followed by energy compensation of the resulting cross-mixed signals usingGammatone gains. The optimized Gammatone gains of direct and reverberant components, as well as the cross-mixing coefficients, are obtained through an optimization procedure in which the binaural room impulse response (BRIR) measured with a real dummy head in the reproduction room is compared to the BRIR of the simulated room generated by RAZR. Compared to our initial study [18], this work investigates the influence of direct and reverberant separation times in BRIRs on both perceptual quality and the energy decay curve (EDC) of the reproduced signal.
The T60 values of the simulated and playback rooms play a critical role in the optimization process. When the simulated room has a longer T60 than the playback room, both energy and interaural coherence (IC) compensation can be achieved across the full frequency spectrum. However, when the T60 values are relatively close, the compensation may be incomplete, particularly at low frequencies where reverberation is more dominant. In such cases, for example when the playback room has a slightly longer T60, the direct sound may unintentionally contribute an excessive amount of reverberant energy that cannot be fully controlled. Nevertheless, despite this limitation at low frequencies, coloration in the higher frequency range can still be effectively corrected. The energy decay curves (EDCs) for both rooms showed significant improvement in the processed cases compared to the unprocessed (UnP) condition. In Room2, where the T60 of the playback room is shorter than that of the simulated room, it is easier to add additional reverberant energy to shape the reverberant sound field. This contrasts with Room1, where the simulated and playback rooms have more closely matched T60 values, making effective control of the reverberant field more challenging.
In the listening experiments, the general, timbral, and spatial similarities between the unprocessed case (UnP) and various versions of the processed signal (P1–P4) were examined. Among the four tested parameter sets, the perceptual evaluation revealed that P3 provided the best balance across general quality and timbre similarity for Room1, while P1 showed the most consistent performance for Room2, particularly in terms of spatial similarity. These results indicate that the optimal choice of separation times between direct and reverberant components may depend on the reverberation characteristics of the simulated scene. Suitable separation times can be empirically selected by comparing the reproduced audiosignals with the simulated reference BRIRs through informal listening. This practical approach resulted in perceptually meaningful renderings. Nevertheless, to improve robustness and reproducibility, future work could explore systematic selection strategies, such as grid search optimization guided by perceptual audio quality models, to automate the tuning of ART parameters across diverse acoustic scenarios.
The results showed that the average scores for the processed signals were higher than those for the unprocessed case, both for speech and for most instruments. Differences in general, timbral, and spatial ratings between the processed and unprocessed conditions were typically significant. Statistical analyses, conducted across all instruments as well as specifically for the snare drum, revealed significant differences among some of the processed versions, highlighting the importance of selecting appropriate separation times. Interestingly, the scoring differences between the unprocessed (UnP) and processed cases are greater for Room1 compared to Room2. This suggests that although compensation for the simulated Room2 is easier, the overall improvement is smaller. In Room1, where the T60 of the simulated room is very close to that of the playback room, the impact of the room-in-room (RinR) impulse responses is more pronounced. As a result, even modest improvements, particularly in the high-frequency range, can have a significant effect on perceived quality. Despite Room1 being more challenging than Room2, the listening test results show only small differences between both rooms.
In our ART system, the binaural room impulse responses (BRIRs) are divided into direct and reverberant components. Early reflections are distributed between these two components. Accurately modeling the acoustic characteristics of early reflections is particularly challenging [29], especially when late early reflections are present in the room impulse response (RIR). One potential improvement to our approach would be to assign early reflections to the direct sound based on the precedence effect, rather than relying on predefined separation times. Further research is needed to investigate the role of early reflections within our method and to enhance the quality of the rendered simulated environment. In the current loudspeaker configuration, direct sound reproduction is limited to the horizontal plane. The ART method may be further improved by incorporating additional loudspeakers in the horizontal plane and adding a ceiling loudspeaker to better capture elevation cues.
Acknowledgments
The authors of this paper would like to thank the German Research Foundation (DFG) for funding this work. We also thank the reviewers for their comments that helped to improve this paper.
Funding
This work is funded by the Deutsche Forschungsgemeinschaft (DFG, German Research Foundation)- Project ID: 352015383- SFB 1330 C2.
Conflicts of interest
The authors declare that they have no conflict of interest related to the content of this article. There are no financial, institutional, or personal relationships with any private or public organizations that could have influenced the results or interpretation presented in this work.
Data availability statement
Data are available on request from the authors.
References
- D. Schröder, P. Dross, M. Vorländer: A fast reverberation estimator for virtual environments, in: AES 30th International Conference, 2007. [Google Scholar]
- D. Schröder, T. Lentz: Real-time processing of image sources using binary space partitioning. Journal of the Audio Engineering Society 54 (2006) 604–619. [Google Scholar]
- C.L. Christensen: Odeon, a design tool for auditorium acoustics, noise control and loudspeaker systems, in: Proceedings of Reproduced Sound 17, 2001, pp. 137–144. [Google Scholar]
- T. Wendt, S. van de Par, S.D. Ewert: A computationally efficient and perceptually plausible algorithm for binaural room impulse response simulation. Journal of the Audio Engineering Society 62, 11 (2014) 748–766. [CrossRef] [Google Scholar]
- F. Pausch: Spatial audio reproduction for hearing aid research: system design, evaluation and application. Dissertation, RWTH Aachen University, 2022. [Google Scholar]
- C. Kirsch, J. Poppitz, T. Wendt, S. van de Par, S.D. Ewert: Spatial resolution of late reverberation in virtual acoustic environments, in: Trends in Hearing. Vol. 25, 2021. [Google Scholar]
- F. Stärz, L.O. Kroczek, S. Roßkopf, A. Mühlberger, S. van de Par, M. Blau: Comparing room acoustical ratings in an interactive virtual environment to those in the real room, in: Proceedings of the 10th Convention of the European Acoustics Association Forum Acusticum, 2023, pp. 5009–5016. [Google Scholar]
- B.U. Seeber, S. Kerber, E.R. Hafter: A system to simulate and reproduce audio–visual environments for spatial hearing research. Hearing Research 260, 1, 2 (2010) 1–10. [CrossRef] [PubMed] [Google Scholar]
- J. Merimaa, V. Pulkki: Spatial impulse response rendering I: analysis and synthesis. Journal of the Audio Engineering Society 53, 12 (2005) 1115–1127. [Google Scholar]
- A. Haeussler, S. van de Par: Crispness, speech intelligibility, and coloration of reverberant recordings played back in another reverberant room. The Journal of the Acoustical Society of America 145, 2 (2019) 931–944. [CrossRef] [PubMed] [Google Scholar]
- N. Kaplanis, S. Bech, T. Lokki, T. van Waterschoot, S.H. Jensen: Perception and preference of reverberation in small listening rooms for multi-loudspeaker reproduction. The Journal of the Acoustical Society of America 146, 5 (2019) 3562–3576. [Google Scholar]
- S. Favrot, J.M. Buchholz: LoRA: a loudspeaker-based room auralization system. Acta Acustica united with Acustica 96, 2 (2010) 364–375. [CrossRef] [Google Scholar]
- V. Best, G. Keidser, J.M. Buchholz, K. Freeston: Development and preliminary evaluation of a new test of ongoing speech comprehension. International Journal of Audiology 55, 1 (2016) 45–52. [Google Scholar]
- A. Guastamacchia, M. Ebri, A. Bottega, E. Armelloni, A. Farina, G.E. Puglisi, F. Riente, L. Shtrepi, M.C. Masoero, A. Astolfi: Set up and preliminary validation of a small spatial sound reproduction system for clinical purposes, in: Forum Acousticum, 2023. [Google Scholar]
- E.C. Hamdan, M.D. Fletcher: A compact two-loudspeaker virtual sound reproduction system for clinical testing of spatial hearing with hearing-assistive devices. Frontiers in Neuroscience 15 (2022) 725127. [Google Scholar]
- J. Grosse, S. van de Par: Perceptually accurate reproduction of recorded sound fields in a reverberant room using spatially distributed loudspeakers. IEEE Journal of Selected Topics in Signal Processing 9, 5 (2015) 867–880. [Google Scholar]
- A. Fallah, S. van de Par: A new approach for rendering Ambisonics recordings on loudspeakers in a reverberant environment, in Forum Acusticum, 2020, pp. 2071–2077. [Google Scholar]
- A. Fallah, S. Gündert, C. Kirsch, S. Nakamura, S. van de Par: Reproduction of simulated acoustic scenes with limited number of loudspeakers in a reverberant room, in: Forum Acousticum 2023, Turin, Italy, 2023. [Google Scholar]
- V. Pulkki: Virtual sound source positioning using vector base amplitude panning. Journal of the Audio Engineering Society 45, 6 (1997) 456–466. [Google Scholar]
- V. Hohmann: Frequency analysis and synthesis using a Gammatone filterbank. Acta Acustica united with Acustica 88, 3 (2002) 433–442. [Google Scholar]
- B.R. Glasberg, B.C. Moore: Derivation of auditory filter shapes from notched-noise data. Hearing Research 47, 1, 2 (1990) 103–138. [CrossRef] [PubMed] [Google Scholar]
- S. van de Par, V. Kot, N. van Schijndel: Scalable noise coder for parametric sound coding, in: 118th Convention of the Audio Engineering Society, 2005. [Google Scholar]
- H. Wierstorf: Perceptual Assessment of Sound Field Synthesis. Technische Universitaet Berlin, 2014. [Google Scholar]
- H. Wierstorf, C. Hohnerlein, S. Spors, A. Raake: Coloration in wave field synthesis, in: AES 55th International Conference: Spatial Audio, 2014. [Google Scholar]
- M.R. Schroeder: New method of measuring reverberation time. The Journal of the Acoustical Society of America 37, 6 (1965) 1187–1188. [Google Scholar]
- ITU-R BS.1534-1: Method for the subjective assessment of intermediate quality level of coding systems, 2003. [Google Scholar]
- ITU-R BS.2399-0: Methods for selecting and describing attributes and terms in the preparation of subjective tests, 2017. [Google Scholar]
- J. Breebaart, S. van de Par, A. Kohlrausch, E. Schuijers: Parametric coding of stereo audio. EURASIP Journal on Advances in Signal Processing 2005 (2005) 105613. [Google Scholar]
- O. Puomio, T. Pihlajakuja, T. Lokki: Sound rendering with early reflections extracted from a measured spatial room impulse response, in: I3DA, 2021, pp. 1–8. [Google Scholar]
Cite this article as: Fallah A. Nakamura S. Gundert S. Kirsch C. & van de Par S. 2025. Reproduction of simulated acoustic scenes for clinical and hearing research in a reverberant room using four horizontal loudspeakers. Acta Acustica, 9, 64. https://doi.org/10.1051/aacus/2025043.
All Tables
All Figures
|
Figure 1 A block diagram of the ART approach. The RAZR room simulator provides two outputs: binaural room impulse responses (BRIRs) at the listener position for headphone rendering, and virtual acoustic sources (VASs) for the direct and reverberant components for loudspeaker rendering. In the upper signal flow, the VASs of the direct sound are mapped onto two loudspeakers using the Vector Base Amplitude Panning (VBAP) method, and the signals are rendered in the playback room after filtering. In the lower signal flow, the VASs of the reverberant sound are mapped onto four loudspeakers using spatial mixing. These signals are then mixed and filtered to control both the interaural coherence (IC) and the reverberant energy at the listening position in the playback room. To preserve the energy characteristics of the original signals, both the direct and reverberant components are compensated using Gammatone filterbank analysis and synthesis prior to playback. In the optimization block, the simulated BRIRs (BRIRref) are compared with the reproduced binaural room-in-room impulse responses (BRinR) measured in the playback room. This comparison is used to determine the optimal mixing coefficients for the reverberant signals, as well as the optimal Gammatone filter gains for both direct and reverberant components. Additionally, the reproduced reverberation time (T60) is controlled by adjusting the separation time between the direct and reverberant parts in both BRIRref and BRinR. |
| In the text | |
|
Figure 2 Block diagram of the optimization process for the ART system with four loudspeakers. The upper outputs from the RAZR room simulation are used in the reproduction chain, which includes mapping the simulated virtual sources onto four loudspeakers, convolving the loudspeaker signals with their respective BRIRs in the playback room, and applying Gammatone filtering. The lower output from RAZR is the binaurally simulated room used as a reference signal (BRIRref). For simplicity, only the BRIRref corresponding to one ear is depicted. The direct and reverberant components of BRIRref are separated at time Tref, and Gammatone filtering is applied in the same manner as for the upper outputs. As shown in the upper part of the figure, the direct signal is rendered using the two front loudspeakers, while the reverberant signal is rendered using all four. The Gammatone filterbank outputs of the rendered binaural room-in-room impulse responses (BRinR) and the BRIRref are then compared to optimize the energy of the direct sound using gd(i) gains, and the energy of the reverberant sound as well as the interaural coherence (IC) of the rendered BRinR using gr(i) gains and cross-mixing coefficients α(i) and β(i). |
| In the text | |
|
Figure 3 Block diagram of ART filtering: After VBAP mapping of simulated direct and reverberant signals, both components are processed through the analysis and synthesis framework of a Gammatone filterbank. For the direct sound, energy-compensation gains gd(i) are applied, while for the reverberant sound, cross-mixing coefficients α(i) and β(i), along with gains gr(i), are used. For each loudspeaker, the direct and reverberant signals are combined and then convolved with an audio file before playback. |
| In the text | |
|
Figure 4 Playback room setup, including four loudspeakers positioned at azimuth angles of 45°, −45°, 135° and −135°. The T30 of the room is 0.50 s. |
| In the text | |
|
Figure 5 Reverberation times in 1/3-octave bands for the two simulated rooms (Room1 and Room2) and the playback room. |
| In the text | |
|
Figure 6 The upper-left and upper-right panels illustrate the gains of the Gammatone filterbank in Room1 for the direct and reverb parts, respectively. The lower-left panel displays the ATF of the compensated direct sound contributed as the reverb part, and the lower-right panel shows the ATF of the total reproduced reverb signal. According to the lower-right panel, in the low frequencies only a marginal increase in decibels is added to the P1 and P2 cases as the reverberant sound. For the P3 case, approximately 5 dB, and for the P4 case, approximately 10 dB are added, indicating a greater potential for incorporating reverberation in these two cases. |
| In the text | |
|
Figure 7 Similar to Figure 6, but showing the data for Room2. As with Room1, the P3 and P4 cases exhibit lower direct gains compared to P1 and P2, indicating a greater potential to incorporate additional reverberant sound into the final signal. |
| In the text | |
|
Figure 8 Comparisons of four processed versions of the ART method (P1, P2, P3, P4) with the reference (Ref) and the unprocessed (UnP) BRIRs in Room1. The two upper panels show the ATFs of BRIRs for Ref, UnP and processed BRIRs for the right and left ears. The lower-left panel illustrates the Interaural Coherence (IC) of the processed and UnP cases, along with their comparison to the reference BRIR for perceptually relevant frequencies below 1500 Hz. The lower-right panel shows the Schroeder energy decay curves (EDCs) of the BRIRs. |
| In the text | |
|
Figure 9 The ATFs for the left and right ears, ICs, and EDCs are shown for Room2. Compared to Room1, the ATFs and ICs of the processed BRIRs in Room2 exhibit a better match to those of the reference case, particularly in the low-frequency bands. Additionally, the lower-right panel illustrates improvements in the EDC and T60 of the processed cases compared to the UnP case. |
| In the text | |
|
Figure 10 Results of the listening test evaluating general-quality similarity in two rooms. The mean scores and standard errors averaged across 13 subjects for each instrument in Room1 and Room2 are shown in the upper panels. In Room1, clear improvements are observed for all instruments when comparing processed cases (P1–P4) to unprocessed (UnP) signals. In Room2, improvements are also observed, except for the clarinet and piano. The lower-left panel displays boxplots showing variation across instruments, with medians, 25th and 75th percentiles, and outliers. The lower-right panel shows mean and standard errors across all instruments. |
| In the text | |
|
Figure 11 Timbre-similarity scores. Results are similar to those in Figure 10, but now focusing on timbre. For Room1, the P3 case generally scores highest. For Room2, the processed P3 and P4 cases show higher mean values than P1, which contrasts with the general similarity results. |
| In the text | |
|
Figure 12 Spatial similarity scores (source width and envelopment) relative to the reference. Results are presented in the same format as Figures 10 and 11. For Room1, P1 achieved the highest mean score for the snare drum. For Room2, results were consistent with earlier tests, with P1 again performing best. |
| In the text | |
Current usage metrics show cumulative count of Article Views (full-text article views including HTML views, PDF and ePub downloads, according to the available data) and Abstracts Views on Vision4Press platform.
Data correspond to usage on the plateform after 2015. The current usage metrics is available 48-96 hours after online publication and is updated daily on week days.
Initial download of the metrics may take a while.