Figure 3
Download original image
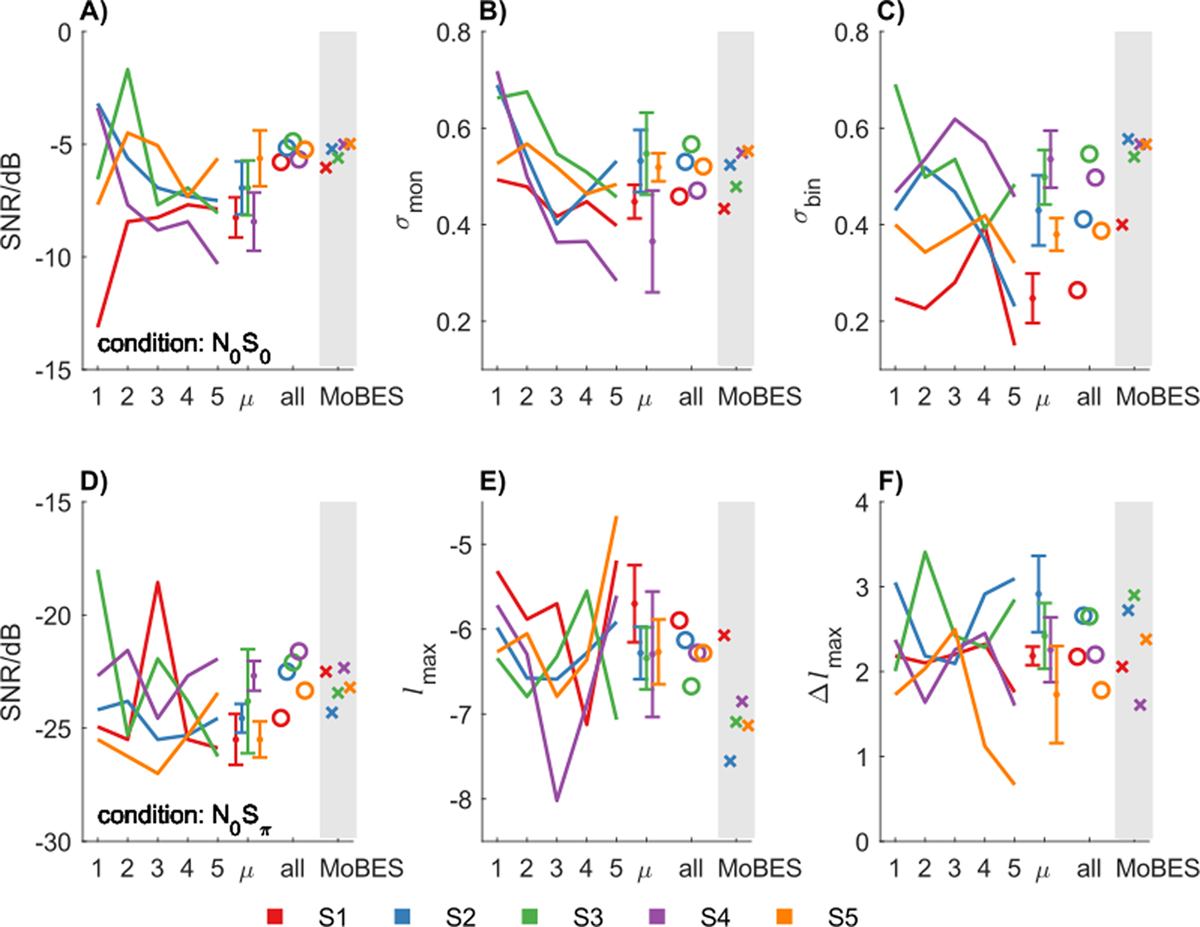
Detection thresholds (SNR, panels A, D) obtained with the adaptive procedure and model parameter estimates (panels B, C, E, F) determined with the parameter estimation module for the adaptive experiment. The lines represent the data for the five individual measurement sets. Their medians and inter-quartile ranges are shown with the dot and the error bars. The circles show the model parameter estimates for running the estimation module for the data of all five sets together. The model parameters for the data obtained with the MoBES procedure are indicated by the crosses above the gray shading.
Current usage metrics show cumulative count of Article Views (full-text article views including HTML views, PDF and ePub downloads, according to the available data) and Abstracts Views on Vision4Press platform.
Data correspond to usage on the plateform after 2015. The current usage metrics is available 48-96 hours after online publication and is updated daily on week days.
Initial download of the metrics may take a while.