Figure 7
Download original image
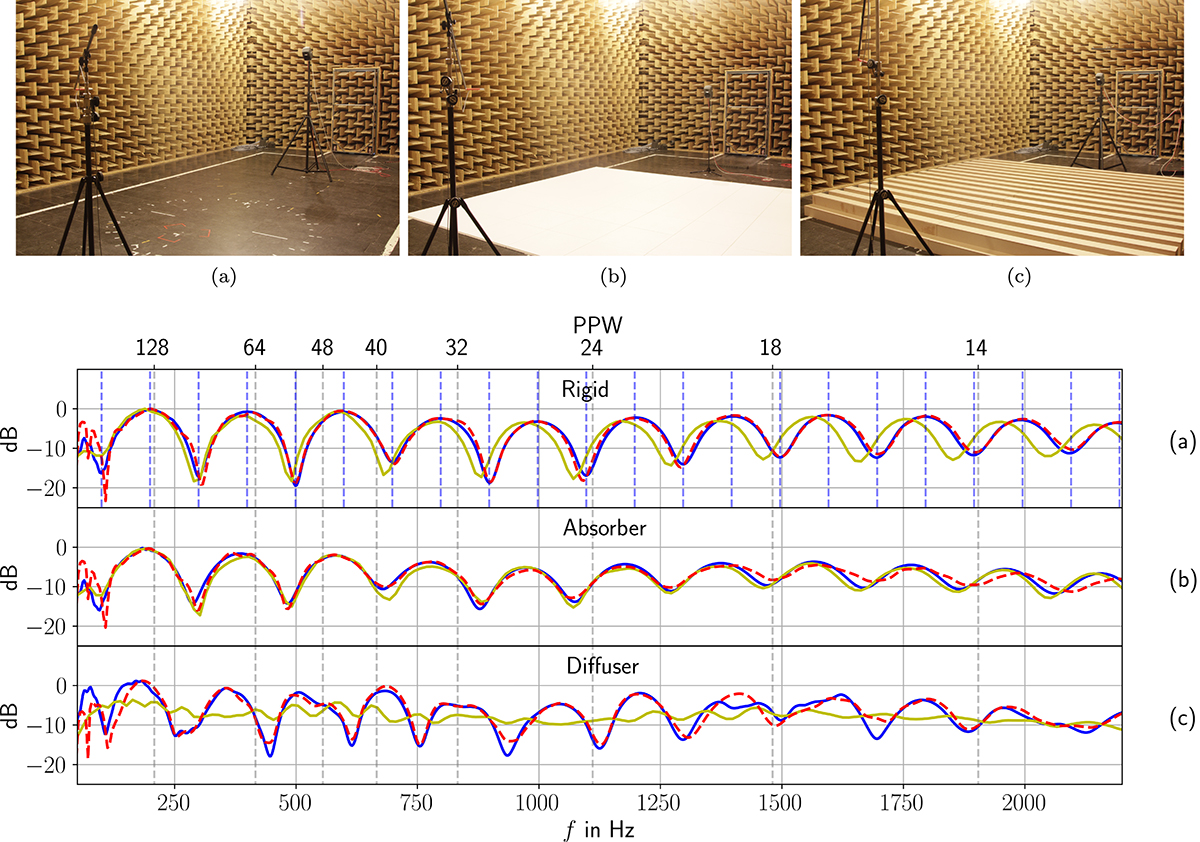
Results of the FDTD simulation (blue) compared to experimental results of the BRAS database, scene RS1 (red dashed line) and simulation results of the BRAS E solver (yellow). In case (a), the blue dashed vertical lines show the analytical comb filter frequencies and the gray dashed vertical lines show the number of PPWs. (a) Rigid, (b) Absorber, (c) Diffuser.
Current usage metrics show cumulative count of Article Views (full-text article views including HTML views, PDF and ePub downloads, according to the available data) and Abstracts Views on Vision4Press platform.
Data correspond to usage on the plateform after 2015. The current usage metrics is available 48-96 hours after online publication and is updated daily on week days.
Initial download of the metrics may take a while.