Figure 6
Download original image
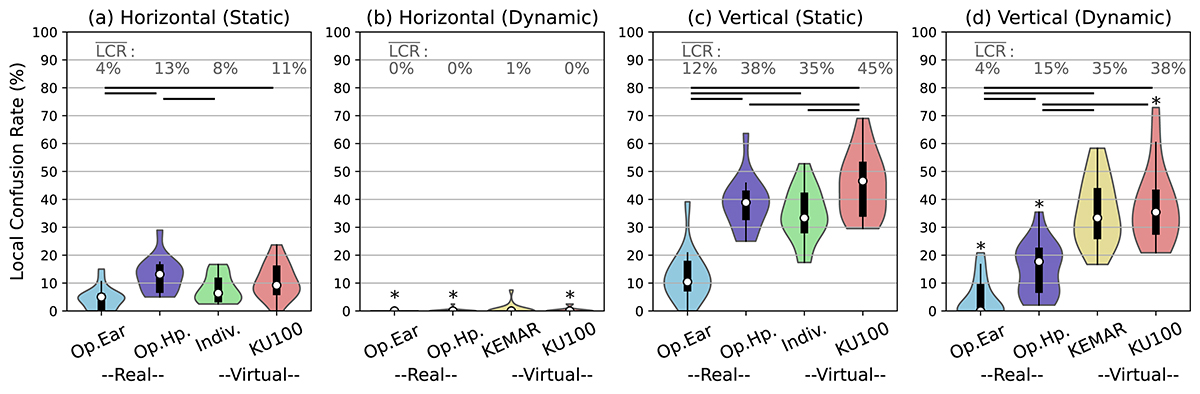
Local confusion rate (LCR) in the horizontal (a,b) and vertical (c,d) dimension of the static (a,c) and dynamic (b,d) auditory-visual localization experiment (N = 16). Violin plots show distributions, and boxplots show medians, interquartile ranges, and adjacent values. Horizontal lines indicate statistically significant differences (p < 0.05, Bonferroni-Holm corrected). Asterisks (*) indicate statistically significant differences (p < 0.05, Bonferroni-Holm corrected) between dynamic and static conditions for open ears, open headphones, and KU100 rendering. Static conditions: Open ears (Op. Ear), open headphones (Op. Hp.), individual BRIR (Indiv.), and KU100 BRIR. Dynamic conditions: Open ears (Op. Ear), open headphones (Op. Hp.), KEMAR HRIR, and KU100 HRIR.
Current usage metrics show cumulative count of Article Views (full-text article views including HTML views, PDF and ePub downloads, according to the available data) and Abstracts Views on Vision4Press platform.
Data correspond to usage on the plateform after 2015. The current usage metrics is available 48-96 hours after online publication and is updated daily on week days.
Initial download of the metrics may take a while.