Open Access
Review
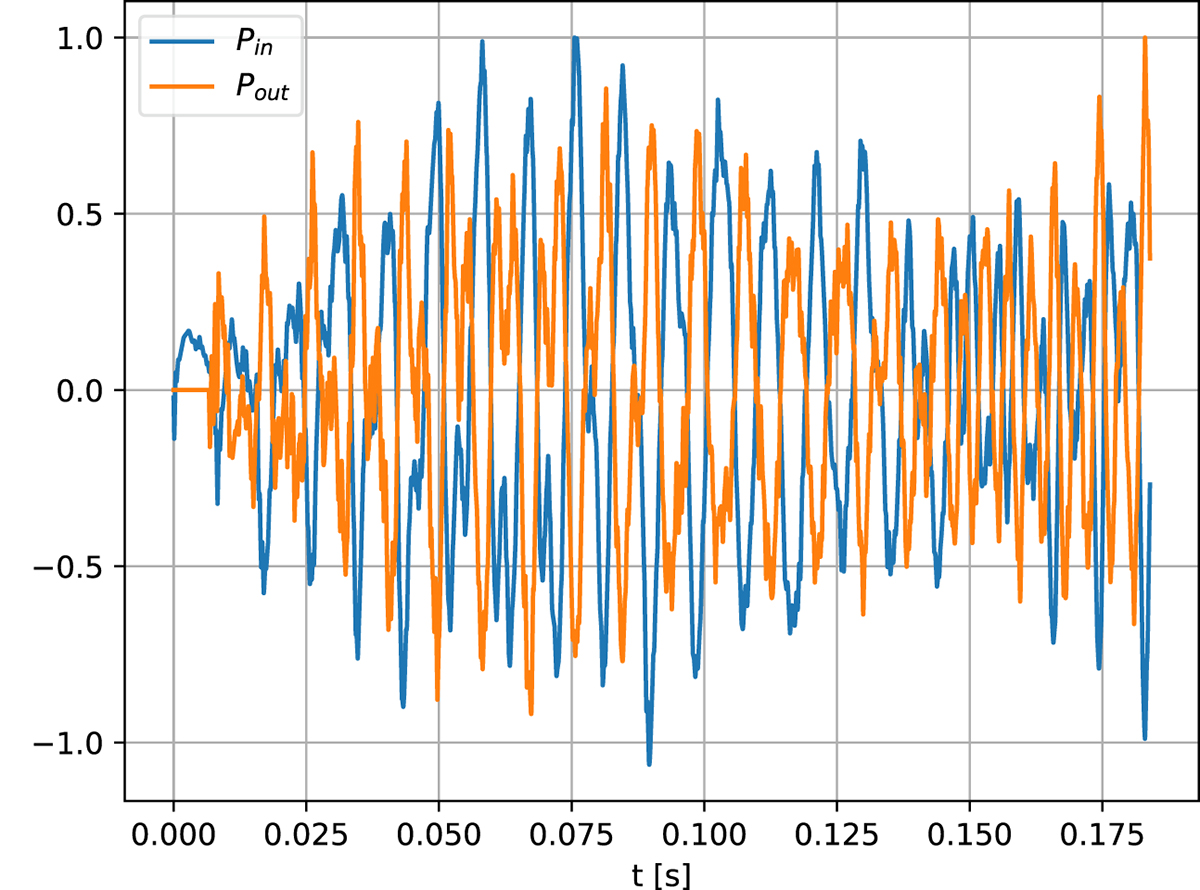
Figure 15.
Download original image
Transfer functions Hi=Zin,ZR in the Fourier domain, with (i=c) control and without (i=∅) control. The amplitude differences and frequency deviations of resonance peaks are noted in Table 5.
Current usage metrics show cumulative count of Article Views (full-text article views including HTML views, PDF and ePub downloads, according to the available data) and Abstracts Views on Vision4Press platform.
Data correspond to usage on the plateform after 2015. The current usage metrics is available 48-96 hours after online publication and is updated daily on week days.
Initial download of the metrics may take a while.