Figure 3
Download original image
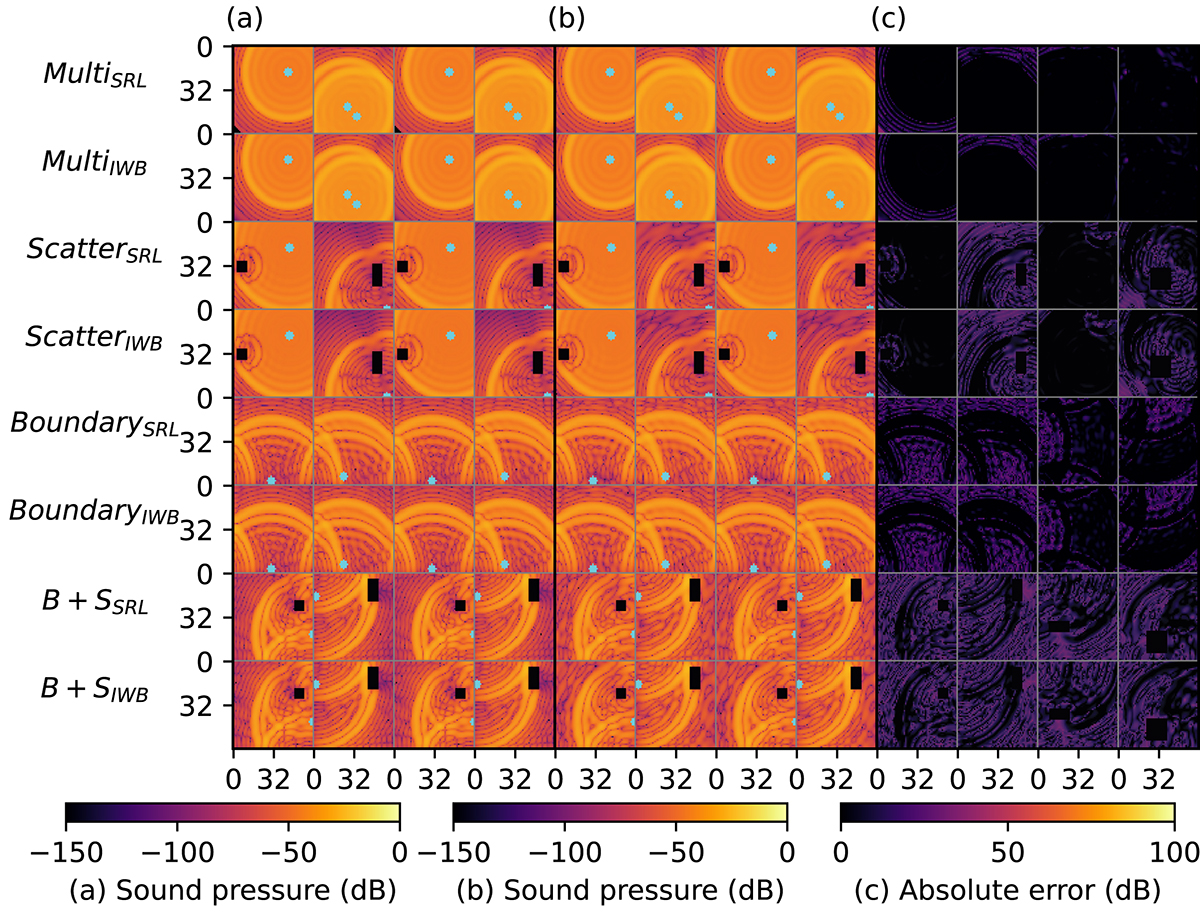
Four setups are demonstrated (columns) for each FNO trained (rows). For the multi-source domains this shows time-step t = 40, and for all others this shows t = 72. Multi-source experiments contain between 1 and 4 simultaneous sound sources. Sound source positions are marked in cyan. Scattering and B+S experiments contain a reflective object of a different size. Boundary experiments feature one randomly positioned sound source. Ground-truth and predicted values are converted to decibels with a reference signal strength of unity. (a) Ground-truth FDTD simulations produced using SRL and IWB stencils. (b) FNO predictions: each prediction from an FNO was obtained by providing the early time-steps of simulations pictured in (a) as input data. (c) Absolute difference in decibels between FNO predictions and ground-truth FDTD simulations.
Current usage metrics show cumulative count of Article Views (full-text article views including HTML views, PDF and ePub downloads, according to the available data) and Abstracts Views on Vision4Press platform.
Data correspond to usage on the plateform after 2015. The current usage metrics is available 48-96 hours after online publication and is updated daily on week days.
Initial download of the metrics may take a while.