


Open Access
Table A.1.
Urban spatial feature indicator selection.
| Parameter | Definition | Formula | Notes | |||||
|---|---|---|---|---|---|---|---|---|
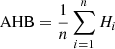
| Building indicators | AHB | The average height of the building within the unit |
|
n is the number of buildings in the cell, Hi is the height of the building i | ||||
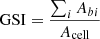
| GSI | Ground space index within the unit |
|
A b i is the base area of the building i, A cell is the cell area | |||||
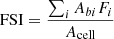
| FSI | Floor space index within the unit |
|
F i is the number of floors of the building i | |||||
| RPBC | The ratio of the total perimeter of the building within the cell to the area of the cell |

|
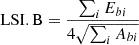
E b i is the length of the boundary of the building i | |||||
| LSI.B | Landscape shape index of buildings |
|
– | |||||
| Traffic indicators | RLI | Road length index within the unit |

|
R i is the length of the road i, E cell is the cell boundary length | ||||
| RAD | Road area density within the unit |

|
A r i is the area of the road i | |||||
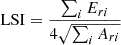
| LSI.R | Landscape shape index of roads within the unit |
|
E r i is the length of the boundary of the road i | |||||
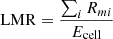
| LMR | The length of the main road within the unit |
|
R m i is the length of the main road i | |||||
| Land use indicators | PC | Proportion of commercial land in the unit |

|
A c is the area of commercial land within a cell | ||||
| PR | Proportion of residential land in the unit |

|
A r is the area of residential land within a cell | |||||
| PT | The proportion of land used for transportation facilities in the unit |

|
A t is the area of traffic land within a cell | |||||
| PG | Proportion of green space in the unit |

|
A g is the area of green space within a cell | |||||
| DLM | Degree of land mix within the unit | DLM = −∑(L m i )(lnL m i ) | L m i is the proportion of land use type i in all land us | |||||
| DFM | Degree of functional mixing within the unit | DFM = −∑(F m i )(lnF m i ) | F m i is the feature type i in full functionality | |||||
Current usage metrics show cumulative count of Article Views (full-text article views including HTML views, PDF and ePub downloads, according to the available data) and Abstracts Views on Vision4Press platform.
Data correspond to usage on the plateform after 2015. The current usage metrics is available 48-96 hours after online publication and is updated daily on week days.
Initial download of the metrics may take a while.