Open Access
Figure 2.
Download original image
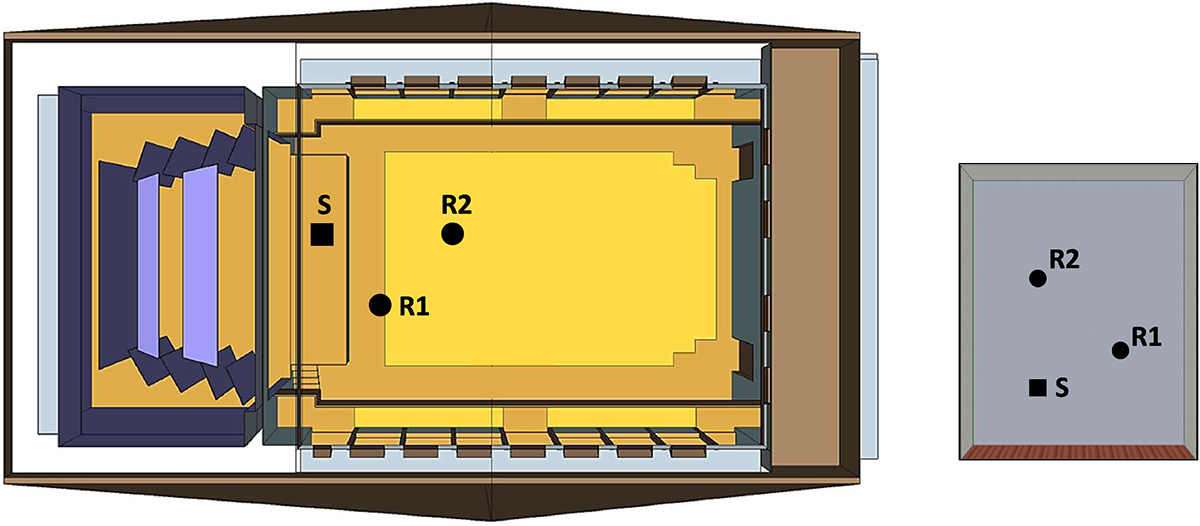
Models of the concert hall and shoebox room used in the listening test. The source position (S) is represented by a square and the receiver positions (R1, R2) by a circle.
Current usage metrics show cumulative count of Article Views (full-text article views including HTML views, PDF and ePub downloads, according to the available data) and Abstracts Views on Vision4Press platform.
Data correspond to usage on the plateform after 2015. The current usage metrics is available 48-96 hours after online publication and is updated daily on week days.
Initial download of the metrics may take a while.