| Issue |
Acta Acust.
Volume 9, 2025
|
|
|---|---|---|
| Article Number | 35 | |
| Number of page(s) | 11 | |
| Section | Physical Acoustics | |
| DOI | https://doi.org/10.1051/aacus/2025017 | |
| Published online | 03 June 2025 | |
Scientific Article
High-sensitivity and low-loss SAW accelerometer base on phononic crystals
1
School of Electronic Information Engineering, China West Normal University Nanchong Sichuan 637009 PR China
2
School of Mechanical and Electrical Engineering, Guilin University of Electronic Technology Guilin 541000 PR China
* Corresponding author: This email address is being protected from spambots. You need JavaScript enabled to view it.
Received:
4
March
2025
Accepted:
16
April
2025
Abstract
The cantilever beam-based surface acoustic wave (SAW) accelerometer has a fast response time and high sensitivity, making it widely used in vibration detection of mechanical structures. In the fabrication and production of the sensor, the sensitivity and loss of the device have always been the key factors of concern. Here, a kind of SAW acceleration resonator based on nanopillar phononic crystals (PnCs) are proposed, and its properties of resonance frequency, phase velocity, quality (Q) factor, electromechanical coupling coefficient, resonance bandgap and acceleration sensitivity are numerically simulated by the finite element method (FEM). The influence of piezoelectric thin film (AlN) thickness and aluminum (Al) interdigital transducers (IDTs) thickness on the performance of the SAW resonator is analyzed with single pair IDT model simulations. It can be seen that PnCs can make SAW in the bandgap (766 MHz–864 MHz) spread along a fixed path or confined array area, effectively reducing acoustic energy loss. The presence of PnCs can improve the resonance frequency, phase velocity, Q factor and acceleration sensitivity of SAW resonator. Especially, the PnCs-SAW accelerometer exhibits a higher Q factor of 1135.3 and linear sensitivity of −4.9 kHz/g within the detection range of 0–70 g. This work is expected to provide a theoretical guidance for the development of SAW acceleration sensors with lower losses and higher sensitivity, offering new ideas for the diverse design of SAW devices.
Key words: Surface acoustic wave / Phononic crystals / Accelerometer / Quality factor / Sensitivity
© The Author(s), Published by EDP Sciences, 2025
 This is an Open Access article distributed under the terms of the Creative Commons Attribution License (https://creativecommons.org/licenses/by/4.0), which permits unrestricted use, distribution, and reproduction in any medium, provided the original work is properly cited.
1 Introduction
Accelerometers are the core components of inertial measurement systems. Thanks to the advantages of micro-electromechanical system (MEMS) sensors, such as small size, light weight, easy integration, low cost, and the ability for mass production, MEMS accelerometers are widely used in various fields including the automotive industry, aerospace, earthquake early warning, and vibration monitoring of bridges and tunnels [1]. Common types of MEMS accelerometers include capacitive accelerometers [2] piezoresistive accelerometers, resonant accelerometers [3], tunnel accelerometers [4], and surface acoustic wave (SAW) accelerometers. Among them, SAW accelerometers are piezoelectric sensors fabricated based on SAW propagation theory, with high sensitivity, fast response time, good stability, and the ability to output digital signals, playing an important role in wireless sensing and detection. Surface acoustic waves, as the name suggests, are solid elastic waves generated on the surface of a semi-infinite solid medium that propagate along its surface or through its cross-section. Taking Rayleigh waves as an example, the surface particles move along elliptical trajectories, and the energy is concentrated within 1–2 wavelengths beneath the surface, making them sensitive to physical changes in external environments such as pressure, temperature, and strain [5, 6]. In 1981, Hartemann P. et al. first used a circular quartz diaphragm to manufacture a SAW accelerometer with a sensitivity of 10 kHz/g within an acceleration range of 20 g [7]. In 2015, the Wang team fabricated a high-sensitivity surface acoustic wave accelerometer with a sensitivity of 29.7 kHz/g using an ST-X quartz cantilever beam [8]. In 2023, Zhao et al. addressed the issue of uneven stress distribution by designing a thickness-variable, isostress SAW accelerometer using ST-cut quartz. The sensor's sensitivity in the 0–15 g range was 1.40 kHz/g [9].
The key issue in improving the performance of surface acoustic wave (SAW) sensors is how to maintain high sensitivity while reducing energy loss and achieving a high Q value. In recent years, with the development and rise of metamaterials, researchers have found that phononic crystals (PnCs) with periodic structures at subwavelength scales exhibit good elastic wave band gaps and guided wave properties within certain frequency ranges [10–12]. By utilizing the ability of PnCs to control the propagation path of acoustic waves, it is possible to adjust their dimensions or introduce defect states to identify resonant modes that strongly couple with the SAW modes, resulting in sharper resonance peaks and higher quality factors. This can achieve high sensitivity and low-loss sensing and detection. In 2009, Wu T.T. and his team designed and fabricated a layered ZnO/Si SAW device with a square lattice of cylindrical holes as PnCs. Tests showed that using PnCs as reflectors reduced attenuation to 7 dB at the center frequency [13]. In 2018, M. Oudich and colleagues studied Rayleigh waves in multilayer columnar phononic crystals and found that restricted modes at the substrate interface coupled with SAWs, leading to increased attenuation [14]. In 2022, J. Bonhomme proposed a Love-wave-based sensing platform that used local resonance from micropillars on the guiding layer surface, achieving higher sensitivity for detecting low particle concentrations in liquid solutions [15].
This work proposes a PnCs-SAW accelerometer based on elastic acoustic effects, using a phononic crystals array to replace the traditional metal electrode reflector gratings. The acceleration sensor model is composed of a force-sensitive cantilever and a surface acoustic wave resonator. The one-port PnCs-SAW resonator is fixed to the upper surface of the cantilever. The coupled wave equation under mechanical and electrical loading was solved by finite element method, and the frequency response and performance of the SAW sensor under acceleration was simulated by COMSOL Multiphysics.
2 Sensor response mechanisms
Acceleration Sensitivity is indeed one of the key indicators for evaluating the performance of an accelerometer, as it directly reflects the accelerometer's ability to respond to input acceleration. It is commonly used to describe its accuracy in detecting or measuring acceleration and the minimum resolvable value. The sensitivity of a SAW accelerometer mainly depends on the changes in wavelength and wave velocity of the SAW resonator under the influence of stress and strain caused by the deformation of the cantilever beam. SAW accelerometers are conventionally affixed to the clamped end surface of a cantilever beam structure incorporating a mass block to achieve maximum stress, strain or acceleration sensitivity [8, 16], as shown in Figures 1a and 1b. The cantilever beam undergoes bending as a result of the inertial effects of the mass load when subjected to acceleration or other external physical forces exerted by a moving object. Upon deformation of the cantilever beam, there is an alteration in the elastic constant and density of the piezoelectric substrate of SAW device [17, 18], leading to a subsequent change in the SAW resonance frequency. Stress, strain or acceleration can be detected by analyzing the frequency shift of SAW.
 |
Figure 1. The construction principle of SAW accelerometers. (a) The structural diagram of the normal SAW accelerometer. (b) The structural diagram of the PnCs-SAW accelerometer. (c) The cross-section view of cantilever beam. (d) The PnCs-SAW resonator undergoes deformation due to stress generated by the cantilever beam. |
The cross-section of the cantilever beam is shown in Figure 1c. The mass block is affected by gravity or other uniform inertial forces F (F=ma, m and a are the proof mass and applied acceleration, respectively), causing the cantilever beam to bend and deform [8]. The stress on the upper surface of the beam can be expressed as
 (1)
(1)
According to formula (1), the longitudinal strain ɛx and transverse strain ɛy are derived as
 (2)
(2)
 (3)
(3)
where lbeam and hbeam are the length and thickness of the cantilever beam, respectively. lmass and hmass are the length and thickness of the proof mass.  is the rotational inertia, while w is the width of the cantilever beam. E and μ are the elastic modulus and Poisson's ratio of the Si cantilever. When x=0, at the fixed end of the beam, there exists a maximum stress σmax on the upper surface of the cantilever beam [19].
The average longitudinal strain  (along x axis) and the average transverse strain
  (along y axis) in the effective resonant cavity of the SAW resonator at the fixed end of the cantilever beam are as follows
 (4)
(4)
 (5)
(5)
where L is the length of the effective resonant cavity of SAW resonator.
When external acceleration is applied to the sensor, strain loads can cause changes in the distance between the IDTs, as well as in the density and elastic coefficients of the piezoelectric material, which in turn alters the wavelength and wave velocity of the SAW resonator. The relationships are given by
 (6)
(6)
 (7)
(7)
where,  and
and  are the average flexing strain parallel and perpendicular to the SAW propagation, respectively. r1 and r2 are the strain coefficients. λ0 and v0 represent the original wavelength and wave speed of the SAW resonator in the unstressed state, respectively.
Consequently, the resonance frequency (f) of the SAW resonator under strain loading can be derived as
 (8)
(8)
And the frequency offset (Δf) is
 (9)
(9)
where f0 denotes the initial frequency at no strain. When ɛ<10−3, r1 in the denominator of equation (9) can be ignored, meanwhile, substituting  ,
,  in equation (9) are given by
 (10)
(10)
The sensitivity of the SAW accelerometer is defined as
 (11)
(11)
3 Simulation results and discussion
3.1 Effects of IDT and AlN thicknesses on SAW resonator performance
The performance of acceleration detection is determined by the structural characteristics of the SAW resonator [20]. SAW resonators can be classified into delay line type [21], single-port resonant type [22], and dual-port resonant type [23] according to their structural differences. The single-ended resonant SAW accelerometer is concerned because good frequency selectivity, a simple structure, and easy of integrate. The periodic boundary model of the proposed SAW resonator is given in Figure 2a. The simulation boundary conditions for the IDT single cycle structure are set as follows in Table 1. The structure consists of a silica substrate, an aluminum nitride (AlN) piezoelectric film and interdigital transducers (IDTs) that produces Rayleigh wave resonant mode SAW and Rayleigh wave anti-resonant mode SAW as shown in Figure 2b and 2c. Compared to ST-X cut quartz (3158 m/s), lanthanum gallium silicate (LGS, 2756 m/s) and ZnO (2650 m/s, perpendicular to the C-axis), aluminum nitride (AlN) has a higher surface acoustic wave propagation velocity (5560 m/s, perpendicular to the C-axis), while also offering advantages such as high mechanical strength and excellent high-temperature thermal stability [24]. Furthermore, the performance of SAW resonators based on different IDT thicknesses and AlN thicknesses was analyzed. In particular, the resonance frequency of the excited SAW is 813 MHz when the thickness of the IDT and the piezoelectric film are 0.15 μm and 1.4 μm respectively.
 |
Figure 2. Performance evaluation of dimensional variations of single-cycle IDT structures. (a) Three-dimensional modelling of IDT single period structure. (b) Rayleigh wave resonant mode. (c) Rayleigh wave anti-resonance mode. (d) The admittance curves Y11 under different AlN thicknesses. (e) The reflection coefficient S11 under different AlN thicknesses. (f) The effects of AlN thickness on electromechanical coupling coefficient k2 (%) and frequency quality factor Q. (g) The admittance curves Y11 under different Al electrodes thicknesses. (h) The reflection coefficient S11 under different Al electrodes thicknesses. (i) The effects of Al electrodes thickness on velocity of SAW and frequency quality factor Q. |
IDT simulation boundary condition setting.
The piezoelectric film is a key material for achieving the conversion between mechanical energy and electrical energy, and its thickness directly impacts the quality factor Q and electromechanical coupling coefficient k2 of the resonator. Therefore, selecting an appropriate thickness of piezoelectric material is crucial for reducing the insertion loss of the resonator and enhancing its operational stability. Figures 2d and 2e illustrate the variation in resonator performance parameters for different thicknesses of AlN films ranging from 1 μm to 2.8 μm (with a step of 0.2 μm). The results show that the admittance and reflection coefficients first increase and then decrease with the increase of AlN thickness, reaching the maximum value when the thickness is 1.4 μm. Figure 2f further analyzes the impact of piezoelectric film thickness on k2 and Q value. The k2 can reach up to 0.5% when the thickness of AlN reaches 1.4 μm, indicating good piezoelectric performance, but the Q value drops as the thickness continues to increase.
During normal operation of SAW devices, efficient excitation and reception of SAW are achieved through the IDTs based on the direct and inverse piezoelectric effects, enabling the continuous conversion between electrical signals and SAW signals. The choice of materials and thickness of the IDT directly affects the performance, frequency selectivity, and overall efficiency of the resonator. Therefore, designing and optimizing the IDT is a key step in enhancing the performance of SAW resonators. A frequency domain analysis was conducted on the Al electrode thickness ranging from 0.15 μm to 0.6 μm (with a step of 0.05 μm). It can be seen from Figures 2g and 2h that the resonance frequency of the SAW resonator gradually decreases, the admittance and reflection coefficients decrease, and the impedance matching performance deteriorates with the increase of IDT thickness. Additionally, the propagation velocity of the SAW and the Q value decrease due to the reduction of the resonance frequency, as shown in Figure 2i.
3.2 The properties of the SAW resonator based on PnCs
PnCs is a high-frequency elastic material composed of two or more media distributed periodically [12, 25]. Within a specific frequency range, acoustic waves or elastic waves are perfectly reflected by the PnCs, and their propagation can be strictly prohibited in other directions. This corresponding frequency range is referred to as a bandgap. According to the physical mechanisms of bandgap formation, bandgaps generated based on Bragg diffraction theory are generally located in higher frequency ranges, while local resonance bandgaps, induced by internal material resonance effects, appear in lower frequency ranges. Based on different PnCs bandgap tuning mechanisms, PnCs can be classified into two types: non-tunable bandgap PnCs and self-tunable bandgap PnCs. The bandgap of non-tunable PnCs is solely determined by its periodic structure and remains fixed. In contrast, self-tunable PnCs enable dynamic real-time bandgap control under external influences such as stress, temperature, magnetic field, or electric field variations [26, 27]. Since the operating frequency range of the SAW sensor in this study is essentially fixed, it is sufficient to ensure that the bandgap covers this range. Therefore, the former is adopted. Leveraging bandgap characteristic, PnCs can be integrated with interdigital transducers to create SAW resonators [28, 29], thereby enhancing the detection performance of surface acoustic waves.
Nanopillar PnCs was adopted because of its simple structure, ease of manufacture and ability to produce a wider band gap. The structure forms a two-dimensional PnCs array with strong structural symmetry through a square periodic arrangement [10, 30]. The cell model of PnCs is shown in Figure 3a, in which aluminum nanopillar PnCs are applied on the top of the AlN. The presence of PnCs will confine the surface acoustic waves to the resonator surface and interact with each other to induce local resonance, forming a local resonance bandgap (LRB) [25]. The two-dimensional PnCs wave vector k propagates in two directions, and the wave loss is swept across the Brillouin zone by moving along the path Γ–X–M–Γ [10, 30], allowing for the acquisition of the PnCs band structure.
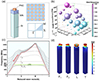 |
Figure 3. Energy band structure analysis. (a) Phononic crystals meta-cellular mode and the first irreducible Brillouin zone of PnCs. (b) Band gap variations at different radius and heights of the scatterer. (c) PnCs energy band structure diagram (r=0.5 μm, h=0.7 μm). (d) The displacement field of PnCs vibrational modes. |
By varying the radius r and height h of the scatterer (nanopillar structural units), the elastic bandgap range and width of the PnCs can be adjusted [31]. In Figure 3b, the two axes in the horizontal plane, the X-axis and the Y-axis, represent the radius and height of the scatterer, respectively. The vertical axis Z represents the starting frequency of the bandgap, and the ending frequency of the bandgap is represented through color mapping. The size of the bubbles reflects the width of the bandgap. With the increase of the radius of the nanopillar, the distance between the adjacent nanopillar decreases, which is conducive to promoting local resonance, resulting in a wider local resonance band gap. Additionally, the resonance frequency increases with the increase of nanopillar radius. The reason is that the contact area between the nanopillar and AlN becomes larger. Meanwhile, the rigidity of the PnCs is influenced by the height of the scatterer. As the height increases, the coupling strength between different parts decreases, leading to a gradual reduction in the distribution range of the bandgap. Figure 3c exhibits the dispersion band diagram of PnCs when the lattice period is λ/4, the scatterer radius is 500 nm, and the height is 700 nm. The light blue shaded area outside the acoustic line represents bulk wave modes, while the area inside the acoustic line indicates surface wave modes [15, 31]. The light green area shows the LBR range from 758 MHz to 851 MHz, which essentially meets the resonant frequency requirements designed for the IDT in Section 3.1. Near the LBR, four distinct horizontal energy bands can be observed, each representing a different vibration mode. When k is scanned to the high-symmetry point X in the Brillouin zone, the PnCs exhibit bending modes F1 and F2 in the lower-frequency bands. As the band frequency increases, the PnCs exhibit a resonant mode L and a twisting mode T. The total displacement u in each mode is given by the Euclidean norm of its components:  , with the overall displacement modes illustrated in Figure 3d.
The PnCs bandgap simulation can model the periodic expansion of the crystal unit cell, but it cannot accurately reflect the amplitude of acoustic wave attenuation. In practical applications, the finite number of PnCs array unit cells can lead to slight variations in the resulting bandgap range. To address this issue, a super-cell model was created to analyze the transmission characteristics of sound waves in PnCs [11, 14, 32]. The structure of this model is shown in Figure 4a. Two pairs of IDTs are set on the left side of the substrate to excite surface acoustic waves, and 12 Al nanopillar (r=500 nm, h=700 nm) are arranged on the right side to form a finite PnCs array. A perfect matching layer (PML) is installed at the bottom of the substrate and at the far end to absorb waves leaking from the boundary. When the vibration frequency changes, the suppression effect of the two-dimensional PnCs array on SAW propagation also varies, and its transmission characteristics can be calculated by formula
 (12)
(12)
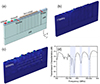 |
Figure 4. Transmission characteristics of the PnCs array. (a) PnCs array super-cellular model. (b) SAW propagation state in the bandgap range. (c) SAW propagation state outside the bandgap range. (d) PnCs array transmission characteristics curve. |
Here,  and
and  represent the total displacements at the excitation end and the receiving end, respectively.
As can be seen from Figure 4b, when the resonance frequency of SAW was 778 MHz, the left PnCs array resonance is significant, while the right PnCs resonance is weak and the displacement change is not obvious. This indicates that the PnCs array effectively inhibits SAW propagation in the band gap. However, when the frequency of the SAW is 900 MHz, all the PnCs show significant resonance and displacement, as shown in Figure 4c. It can be inferred that out-of-bandgap SAW is not suppressed in array PnCs and can propagate freely. Figure 4d exhibits the analysis of SAW propagation characteristics of the super-cell model in the frequency sweep range of 700 MHz–900 MHz. It can be seen that the SAW is significantly attenuated in the frequency range of 766 MHz and 864 MHz. It is indicated that the SAW attenuation frequency range of the PnCs super-cell model is basically consistent with the LBR frequency range of the single-cycle structure PnCs (see Fig. 3c). It can be further concluded that PnCs have a definite operating frequency bandgap. PnCs can make SAW in the bandgap spread along a fixed path or confined array area, thus effectively reducing energy loss.
3.3 Resonator performance comparison
Further, a comparative analysis between the metal reflective gratings (MRG) SAW resonator (Fig. 5a) and the PnCs-SAW resonator (Fig. 5b) was performed.
 |
Figure 5. Resonator simulation models. (a) The normal SAW resonator full structure model. (b) The PnCs-SAW resonator full structure model. |
The design parameters of the resonator simulation model are shown in Table 2. The thickness of the resonator in the y-direction is set to λ/4, corresponding to one lattice constant, and periodic boundary conditions are applied to simulate infinite extension in the thickness direction.
Simulation parameters of the SAW resonators.
Figure 6a shows the frequency domain analysis of the conventional SAW resonator, MRG-SAW resonator and PnCs-SAW resonator. Conventional SAW resonator has smaller admittance. The reflection and interference characteristics of SAW are affected by the application of MRG, resulting in more stray mode acoustic waves. The admittance of the MRG-SAW resonator has not been effectively improved. It is noteworthy that the implementation of PnCs array significantly enhances the admittance characteristics of SAW resonators, while also contributing to the suppression of parasitic acoustic wave generation. At the same time, the resonance frequency slightly increases to 818 MHz due to the smaller size and lighter mass of the PnCs-SAW resonator.
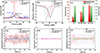 |
Figure 6. Performance comparison of SAW resonators with different structures. (a) Admittance curves for SAW devices. (b) Reflection coefficient curves for SAW devices. (c) Quality factor and wave velocity of the SAW devices. (d) X-component of the surface displacement field for the SAW devices. (e) Y-component of the surface displacement field for the SAW devices. (f) Z-component of the surface displacement field for the SAW devices. |
Figure 6b illustrates the reflection coefficients of the three types of SAW resonators, the differences are not very significant. The Q factor and phase velocity characteristics of three SAW resonators were also compared and analyzed. Quality Factor (Q) is a dimensionless parameter that measures the energy loss and storage efficiency of a vibrating system (such as a mechanical system, circuit, or resonator), defined as: Q=2πU/Ud (U represents the mechanical energy stored in the device per cycle, Ud while denotes the energy lost per cycle.) Typically, the Q value of SAW devices must be at least greater than 500 to meet the basic requirements for frequency selectivity and signal processing. The higher Q value, the less energy is lost during vibration, resulting in a sharper resonance peak and a more sensitive frequency response. Here, the Q factor is calculated using the 3 dB bandwidth method Q=f/Δf, and the results are shown in Figure 6c. It is evident that the PnCs-SAW resonator has the highest Q value of 1135.3, which is much higher than the other two SAW resonators (332 and 672.92). In addition, the phase velocity of the SAW in the PnCS-SAW resonator (4908 m/s) is slightly higher than that of the MRG-SAW resonator (4900.8 m/s) due to its higher resonance frequency.
To further compare the ability of Al IDTs and the PnCs to concentrate acoustic waves in the region of the IDTs, time-domain simulations were conducted on the aforementioned three SAW structures. An input pulse signal was used as the excitation source, and a pair of edge-finger IDT was selected as the detection object. Referring to the coordinate view in Figure 4a. The trends of surface displacement field components in the the direction of wave propagation X-axis, the direction perpendicular to the out-of-plane Y-axis, and the direction of the substrate Z-axis over time are depicted in Figures 6d, 6e and 6f. In Figure 6d, the maximum X-axis component of the PnCs-SAW device indicates that the PnCs enhances the propagation of acoustic waves in the horizontal direction, concentrating the energy more effectively. Figure 6e shows that the out-of-plane Y-axis components of all three structures approach zero due to the IDT exciting Rayleigh mode waves. Figure 6f indicates that the independent IDT structure exhibits the largest particle motion displacement in the Z-axis direction compared to the other two resonators, suggesting that more energy leaks into the substrate during SAW transmission. In the PnCs-SAW structure, the scatterer incrementally captures energy during wave propagation, thereby inhibiting its transmission to the substrate. This process leads to a swift attenuation of the Z-axis direction displacement component over time.
3.4 Accelerometers detection sensitivity prediction
In view of the technical advantages of PnCs, the PnCs-SAW accelerometer with high Q-factor was further designed and analyzed to evaluate acceleration sensitivity. The conventional SAW resonator and PnCs-SAW resonator were integrated into the surface of an equivalent cantilever beam using an adhesive curing process, and the relevant design parameters are shown in Table 3.
Design parameters of cantilever beam.
When simulating the SAW accelerometer in COMSOL, the solid mechanics field solid1 is used to obtain the force field distribution of the cantilever beam under the influence of acceleration. The piezoelectric field pze1 (comprising a solid mechanics field solid2 and an electrostatics field es1) solves the acoustic wave equation of the SAW resonator. The initial stress and strain distribution obtained in solid1 is incorporated into the stress–strain solution equation in solid2 [9, 19], indirectly coupling the force-sensitive structure with the SAW resonator. By analyzing the pre-stress Eigen frequency of the SAW device, the Eigen frequency under acceleration can be obtained. Using frequency domain analysis, the shift in admittance Y11 or reflection coefficient S11 at different acceleration values can be observed, providing a clear representation of the SAW accelerometer's frequency response to acceleration [19, 33].
Parametric scanning changes the acceleration magnitude and the stress distribution on the upper surface of the SAW resonator beam shows a linear change, as shown in Figure 7a, the horizontal axis indicates the distance between any point on the center line of the upper surface of the beam and the fixed end. The cantilever beam is prepared from monocrystalline silicon with a compressive strength of 120 MPa, and the detection range of the conventional SAW accelerometer is limited to 100 g in order to ensure the normal use of the accelerometer. Figure 7b visualizes the frequency shift effect of the sensor detection. Figure 7c fitted the intrinsic frequency shift curve of the conventional SAW accelerometer with a linear fitting coefficient of 0.9999 and a sensitivity of −4.53 kHz/g. The applied acceleration exhibits a very good linear relationship with the Eigen frequency of the conventional SAW resonator.
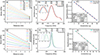 |
Figure 7. SAW accelerometers detection sensitivity prediction. (a) Stress distribution on the upper surface of cantilever beam of the normal SAW accelerometer. (b) Acceleration-frequency response of the converntional SAW accelerometer. (c) Sensitivity analysis of the normal SAW accelerometer. (d) Stress distribution on the upper surface of cantilever beam of PnCs-SAW accelerometer. (e) Acceleration-frequency response of the PnCs-SAW Accelerometer. (f) Sensitivity analysis of the PnCs-SAW accelerometer. |
The PnCs-SAW resonator has a more obvious response to the stress and strain of the beam due to the existence of PnCs structure (Figure 7d). Figure 7e analyze the frequency response of the PnCs-SAW resonator to the applied acceleration in range of 0–70 g. The Eigen frequency variation of the PnCs-SAW accelerometer with a good linear fit relationship of 0.9997 and a predicted sensitivity of −4.9 kHz/g, as shown in Figure 7f. It can be seen that the acceleration sensitivity of PnCs-SAW resonator is better than that of conventional SAW resonator.
4 Conclusion
In this work, a kind of SAW accelerometer resonator based on PnCs is presented. A systematic analysis is conducted on the effects of AlN piezoelectric film thickness, electrode thickness, and phononic crystals on the performance of the SAW resonator. The presence of phonon crystals can improve the basic performance of SAW resonators, including high resonance frequency, high phase velocity, high Q factor and high acceleration sensitivity. Especially, the PnCs-SAW accelerometer with a higher Q factor of 1135.3 and sensitivity of −4.9 kHz/g is designed and analyzed.
SAW and PnCs are both interdisciplinary fields involving acoustics, materials science, and micro-nano fabrication. This paper significantly enhances the Q value of devices through the interdisciplinary integration of surface acoustic wave (SAW) technology and phononic crystal (PnCs) bandgap theory. Meanwhile, it provides new insights for the design of high-frequency, high-sensitivity sensors and RF devices. This achievement not only validates the feasibility of theoretical innovations but also highlights the crucial role of interdisciplinary collaboration in driving advancements in cutting-edge technology. The structural design of PnCs is highly diverse, considering future trends in PnCs development, flexible MEMS materials can be used to fabricate PnCs microstructures. When a PnCs-SAW acceleration sensor experiences stress variations, the bandgap generated by PnCs may adaptively adjust with the resonator's frequency shift. This has significant implications for enhancing the high-sensitivity detection range of acceleration.
Acknowledgments
We acknowledge support from the Natural Science Foundation of Sichuan Province (No. 2022NSFSC1996) and the National Natural Science Foundation of China (No. 52105327). We also want to thank the full support by Nanchong Key Laboratory of Electromagnetic Technology and Engineering (No. NCKL202005).
Conflicts of interest
The authors declare that they have no conflicts of interest in relation to this article.
Data availability statement
Data are available on request from the authors.
References
- C. Ge, E. Cretu: A polymeric piezoelectric MEMS accelerometer with high sensitivity, low noise density, and an innovative manufacturing approach. Microsystems & Nanoengineering 9, 1 (2023) 151 [CrossRef] [PubMed] [Google Scholar]
- Z. Mohammed, I.M. Elfadel, M. Rasras: Monolithic multi degree of freedom (MDoF) capacitive MEMS accelerometers. Micromachines 9, 11 (2018) 602 [CrossRef] [PubMed] [Google Scholar]
- Y. Li, L. Song, S. Liang, Y. Xiao, F. Yang: Nonlinear vibration study based on uncertainty analysis in MEMS resonant accelerometer. Sensors 20, 24 (2020) 7207 [CrossRef] [PubMed] [Google Scholar]
- H. Dong, Y. Jia, Y. Hao, S. Shen: A novel out-of-plane MEMS tunneling accelerometer. Sensors and Actuators A: Physical 120, 2 (2005) 360–364 [CrossRef] [Google Scholar]
- C. Caliendo: Conductometric sensing capabilities of Rayleigh modes in ZnO/Si structures. Journal of Physics D-Applied Physics 54, 8 (2021) 085101 [CrossRef] [Google Scholar]
- D. Mandal, S. Banerjee: Surface acoustic wave (SAW) sensors: physics, materials, and applications. Sensors 22, 3 (2022) 820 [CrossRef] [PubMed] [Google Scholar]
- P. Hartemann, P.-L. Meunier: Surface acoustic wave accelerometer, in 1981 Ultrasonics Symposium. IEEE (1981) 152–154 [Google Scholar]
- W. Wang, Y. Huang, X. Liu, Y. Liang: Surface acoustic wave acceleration sensor with high sensitivity incorporating ST-X quartz cantilever beam. Smart Materials and Structures 24, 1 (2015) 015015 [CrossRef] [Google Scholar]
- Y. Zhao, J. Zhou, L. Kuang, Y. Guo, J. Xie, Y. Fu: Equal-strength beam design of acoustic wave accelerometers. Physica Scripta 98, 12 (2023) 125205 [CrossRef] [Google Scholar]
- Y. Achaoui, A. Khelif, S. Benchabane, L. Robert, V. Laude: Experimental observation of locally-resonant and Bragg band gaps for surface guided waves in a phononic crystal of pillars. Physical Review B 83, 10 (2011) 104201 [CrossRef] [Google Scholar]
- A. Khelif, Y. Achaoui, S. Benchabane, V. Laude, B. Aoubiza: Locally resonant surface acoustic wave band gaps in a two-dimensional phononic crystal of pillars on a surface. Physical Review B 81, 21 (2010) 214303 [CrossRef] [Google Scholar]
- J.N. Kirchhof, K. Weinel, S. Heeg, V. Deinhart, S. Kovalchuk, K. Höflich, K.I. Bolotin: Tunable graphene phononic crystal. Nano Letters 21, 5 (2021) 2174–2182 [CrossRef] [PubMed] [Google Scholar]
- T.-T. Wu, W.-S. Wang, J.-H. Sun: A layered SAW device using phononic-crystal reflective gratings, in 2008 IEEE Ultrasonics Symposium. IEEE (2008) 709–712 [Google Scholar]
- M. Oudich, B. Djafari-Rouhani, B. Bonello, Y. Pennec, S. Hemaidia, F. Sarry, D. Beyssen: Rayleigh waves in phononic crystal made of multilayered pillars: confined modes, fano resonances, and acoustically induced transparency. Physical Review Applied 9, 3 (2018) 034013 [CrossRef] [Google Scholar]
- J. Bonhomme, M. Oudich, M.L.F. Bellaredj, J.-F. Bryche, P.A. Segura Chavez, D. Beyssen, P.G. Charette, F. Sarry: Micropillared surface to enhance the sensitivity of a love-wave sensor. Physical Review Applied 17, 6 (2022) 064024 [CrossRef] [Google Scholar]
- H. Jiang, W.K. Lu, Y.Y. Li, S.G. Shen: Analysis of a novel SAW acceleration sensor with cantilever beam using ST-X quartz. Applied Mechanics and Materials 189 (2012) 285–289 [CrossRef] [Google Scholar]
- A.L. Nalamwar, M. Epstein: Surface acoustic waves in strained media. Journal of Applied Physics 47, 1 (1976) 43–48 [CrossRef] [Google Scholar]
- B.K. Sinha, W.J. Tanski, T. Lukaszek, A. Ballato: Influence of biasing stresses on the propagation of surface waves. Journal of Applied Physics 57, 3 (1985) 767–776 [CrossRef] [Google Scholar]
- L. Kuang, J. Zhou, Y. Guo, H. Duan, Y.Q. Fu: Versatile and effective design platform for surface acoustic wave accelerometers. Physica Scripta 98, 8 (2023) 085408 [CrossRef] [Google Scholar]
- C.K. Kent, N. Ramakrishnan, H.P. Kesuma: Advancements in one-port surface acoustic wave (SAW) resonators for sensing applications: a review. IEEE Sensors Journal 24, 11 (2024) 17337–17352 [CrossRef] [Google Scholar]
- F. Kanouni, F. Laidoudi, S. Amara, K. Bouamama: Improvement of surface acoustic wave delay lines using C-Axis tilted AlScN thin film. Acoustical Physics 68, 5 (2022) 447–458 [CrossRef] [Google Scholar]
- G. Boldeiu, G.E. Ponchak, A. Nicoloiu, C. Nastase, I. Zdru, A. Dinescu, A. Müller: Investigation of temperature sensing capabilities of GaN/SiC and GaN/sapphire surface acoustic wave devices. IEEE Access 10 (2022) 741–752 [CrossRef] [Google Scholar]
- C.L. Cheng, Z.H. Lu, J.W. Yang, X.Y. Gong, Q.Q. Ke: Modulating the performance of the SAW strain sensor based on dual-port resonator using FEM simulation. Materials 16, 8 (2023) 3269 [CrossRef] [PubMed] [Google Scholar]
- Z. Ji, J. Zhou, H. Lin, J. Wu, D. Zhang, S. Garner, A. Gu, S. Dong, Y. Fu, H. Duan: Flexible thin-film acoustic wave devices with off-axis bending characteristics for multisensing applications. Microsystems & Nanoengineering 7, 1 (2021) 97 [CrossRef] [PubMed] [Google Scholar]
- M.S. Kushwaha, P. Halevi, L. Dobrzynski, B. Djafari-Rouhani: Acoustic band structure of periodic elastic composites. Physical Review Letters 71, 13 (1993) 2022 [CrossRef] [PubMed] [Google Scholar]
- K. Wang, J.H. Yin, L. Cao, P.Y. Guo, G.T. Fan, J.Y. Qin, S. Yang: Investigation on waveguide and directional transmission properties of a tunable liquid-solid phononic crystal based on rotation of scatterer. Nano 20 (2024) 2450132 [Google Scholar]
- X.L. Zhou, J.H. Yin, K. Wang, S. Yang, L. Cao, P.Y. Guo: Band gap tuning and wave separator design in 3D composite slab structures based on periodic thermal fields. Mechanics of Advanced Materials and Structures 32 (2025) 1343–1351 [CrossRef] [Google Scholar]
- S. Benchabane, R. Salut, O. Gaiffe, V. Soumann, M. Addouche, V. Laude, A. Khelif: Surface-wave coupling to single phononic subwavelength resonators. Physical Review Applied 8, 3 (2017) 034016 [CrossRef] [Google Scholar]
- P.L. Tang, H.Z. Pan, T.B. Workie, J. Mi, J.F. Bao, K.Y. Hashimoto: Honeycomb-shaped phononic crystals on 42° Y–X LiTaO3/SiO2/Poly–Si/Si substrate for improved performance and miniaturization. Micromachines 15, 10 (2024) 1256 [CrossRef] [PubMed] [Google Scholar]
- M. Badreddine Assouar, M. Oudich: Dispersion curves of surface acoustic waves in a two-dimensional phononic crystal. Applied Physics Letters 99, 12 (2011) 123505 [CrossRef] [Google Scholar]
- D. Yudistira, Y. Pennec, B. Djafari Rouhani, S. Dupont, V. Laude: Non-radiative complete surface acoustic wave bandgap for finite-depth holey phononic crystal in lithium niobate. Applied Physics Letters 100, 6 (2012) 061912 [CrossRef] [Google Scholar]
- D. Yudistira, A. Boes, B. Djafari-Rouhani, Y. Pennec, L.Y. Yeo, A. Mitchell, J.R. Friend: Monolithic phononic crystals with a surface acoustic band gap from surface phonon-polariton coupling. Physical Review Letters 113, 21 (2014) 215503 [CrossRef] [PubMed] [Google Scholar]
- J. Zhang, W.H. Cheng, H. Wang, L. Zhang, X.R. Li, H.S. Ma, J.Q. Pang, Q.L. Tan: Langasite-based SAW high-temperature vibration sensor with temperature decoupling. Science China-Technological Sciences 67 (2024) 1946–1956 [CrossRef] [Google Scholar]
Cite this article as: Yuan R. Xu Z. & Wei S. 2025. High-sensitivity and low-loss SAW accelerometer base on phononic crystals. Acta Acustica, 9, 35. https://doi.org/10.1051/aacus/2025017.
All Tables
All Figures
|
Figure 1. The construction principle of SAW accelerometers. (a) The structural diagram of the normal SAW accelerometer. (b) The structural diagram of the PnCs-SAW accelerometer. (c) The cross-section view of cantilever beam. (d) The PnCs-SAW resonator undergoes deformation due to stress generated by the cantilever beam. |
| In the text | |
|
Figure 2. Performance evaluation of dimensional variations of single-cycle IDT structures. (a) Three-dimensional modelling of IDT single period structure. (b) Rayleigh wave resonant mode. (c) Rayleigh wave anti-resonance mode. (d) The admittance curves Y11 under different AlN thicknesses. (e) The reflection coefficient S11 under different AlN thicknesses. (f) The effects of AlN thickness on electromechanical coupling coefficient k2 (%) and frequency quality factor Q. (g) The admittance curves Y11 under different Al electrodes thicknesses. (h) The reflection coefficient S11 under different Al electrodes thicknesses. (i) The effects of Al electrodes thickness on velocity of SAW and frequency quality factor Q. |
| In the text | |
|
Figure 3. Energy band structure analysis. (a) Phononic crystals meta-cellular mode and the first irreducible Brillouin zone of PnCs. (b) Band gap variations at different radius and heights of the scatterer. (c) PnCs energy band structure diagram (r=0.5 μm, h=0.7 μm). (d) The displacement field of PnCs vibrational modes. |
| In the text | |
|
Figure 4. Transmission characteristics of the PnCs array. (a) PnCs array super-cellular model. (b) SAW propagation state in the bandgap range. (c) SAW propagation state outside the bandgap range. (d) PnCs array transmission characteristics curve. |
| In the text | |
|
Figure 5. Resonator simulation models. (a) The normal SAW resonator full structure model. (b) The PnCs-SAW resonator full structure model. |
| In the text | |
|
Figure 6. Performance comparison of SAW resonators with different structures. (a) Admittance curves for SAW devices. (b) Reflection coefficient curves for SAW devices. (c) Quality factor and wave velocity of the SAW devices. (d) X-component of the surface displacement field for the SAW devices. (e) Y-component of the surface displacement field for the SAW devices. (f) Z-component of the surface displacement field for the SAW devices. |
| In the text | |
|
Figure 7. SAW accelerometers detection sensitivity prediction. (a) Stress distribution on the upper surface of cantilever beam of the normal SAW accelerometer. (b) Acceleration-frequency response of the converntional SAW accelerometer. (c) Sensitivity analysis of the normal SAW accelerometer. (d) Stress distribution on the upper surface of cantilever beam of PnCs-SAW accelerometer. (e) Acceleration-frequency response of the PnCs-SAW Accelerometer. (f) Sensitivity analysis of the PnCs-SAW accelerometer. |
| In the text | |
Current usage metrics show cumulative count of Article Views (full-text article views including HTML views, PDF and ePub downloads, according to the available data) and Abstracts Views on Vision4Press platform.
Data correspond to usage on the plateform after 2015. The current usage metrics is available 48-96 hours after online publication and is updated daily on week days.
Initial download of the metrics may take a while.