Open Access
Figure 8.
Download original image
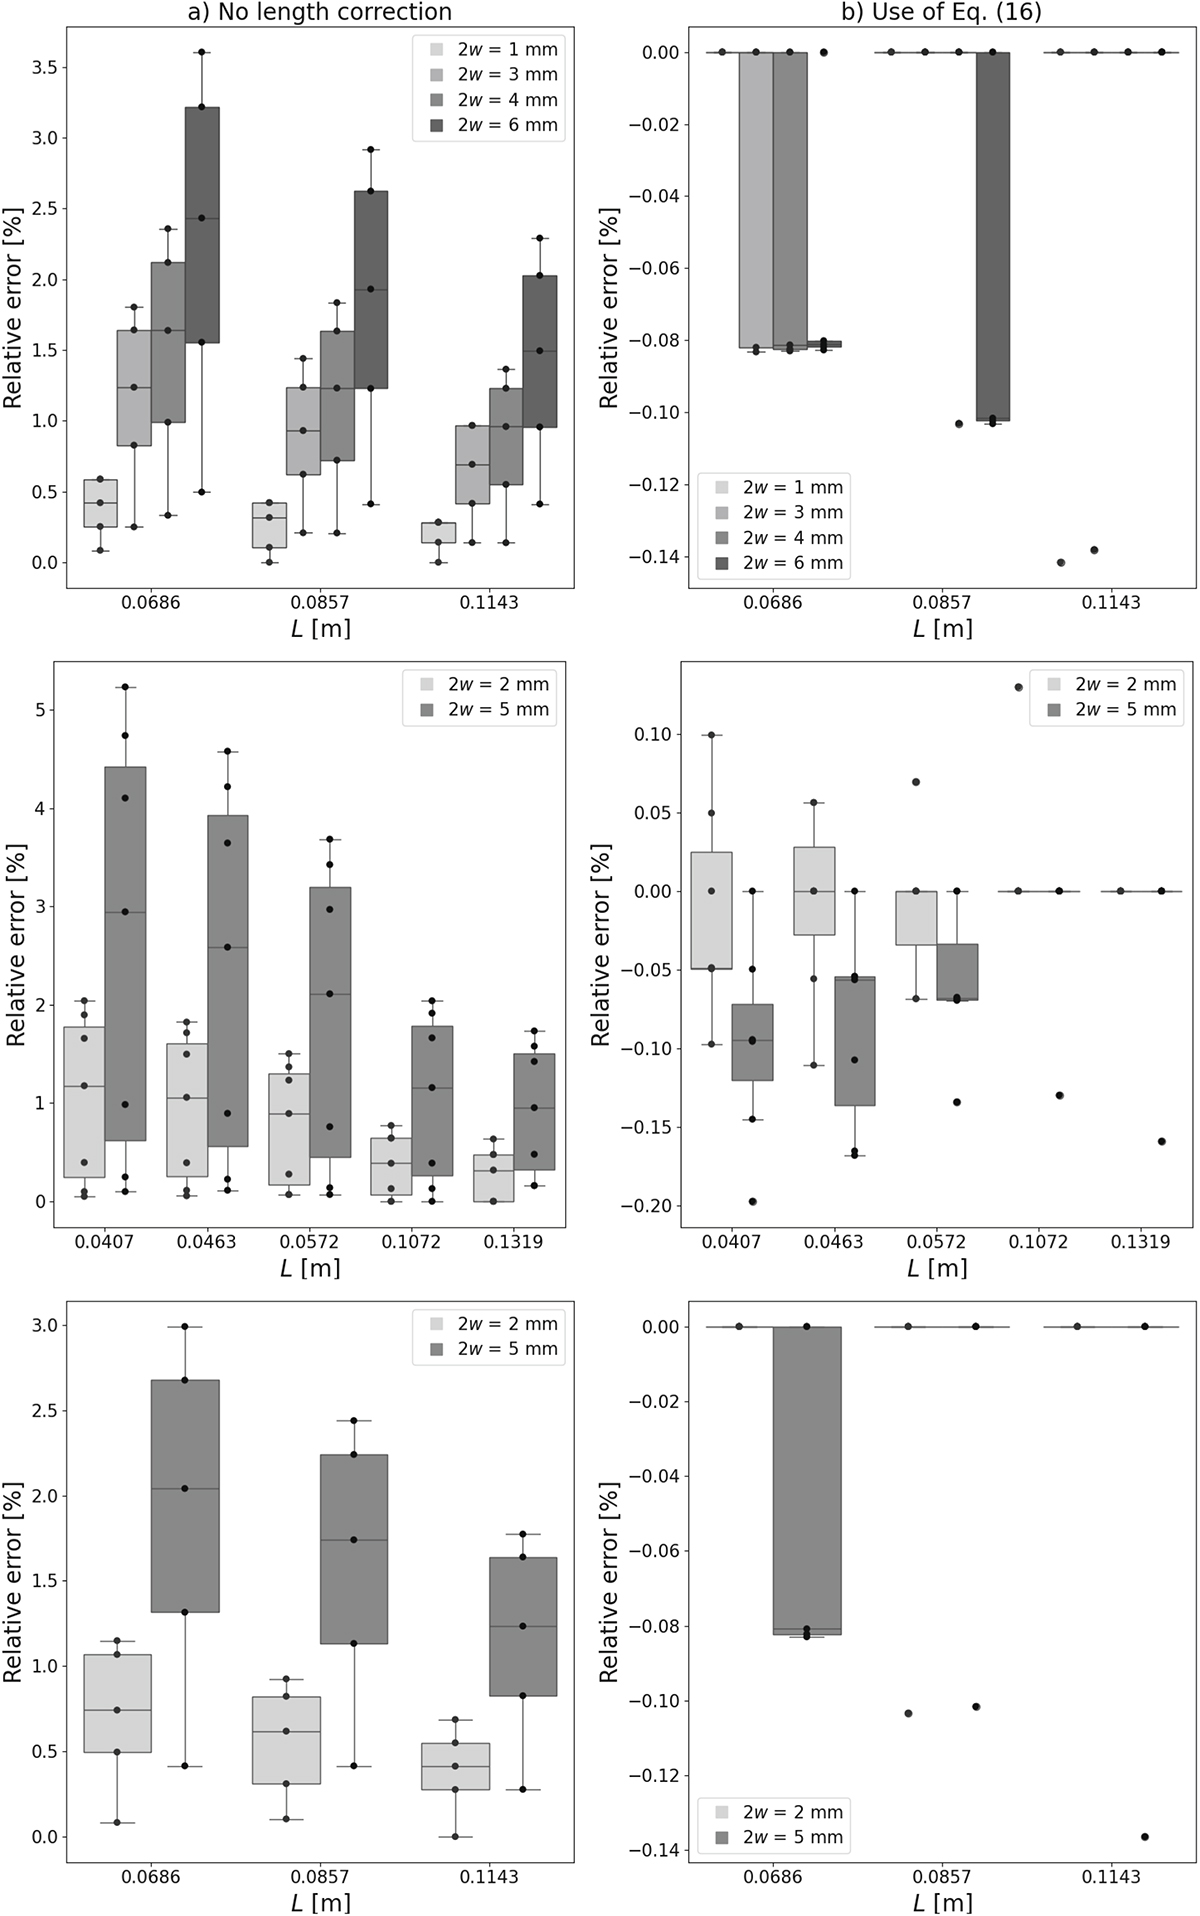
Overview of the relative error between the numerical and analytical predicted resonance frequency for the resonators in Set A (top), Set B (middle) and Set C (bottom), either or not applying equation (16). Each dot represents a different resonator. (a) No length correction. (b) Use of equation (16).
Current usage metrics show cumulative count of Article Views (full-text article views including HTML views, PDF and ePub downloads, according to the available data) and Abstracts Views on Vision4Press platform.
Data correspond to usage on the plateform after 2015. The current usage metrics is available 48-96 hours after online publication and is updated daily on week days.
Initial download of the metrics may take a while.