Figure 10
Download original image
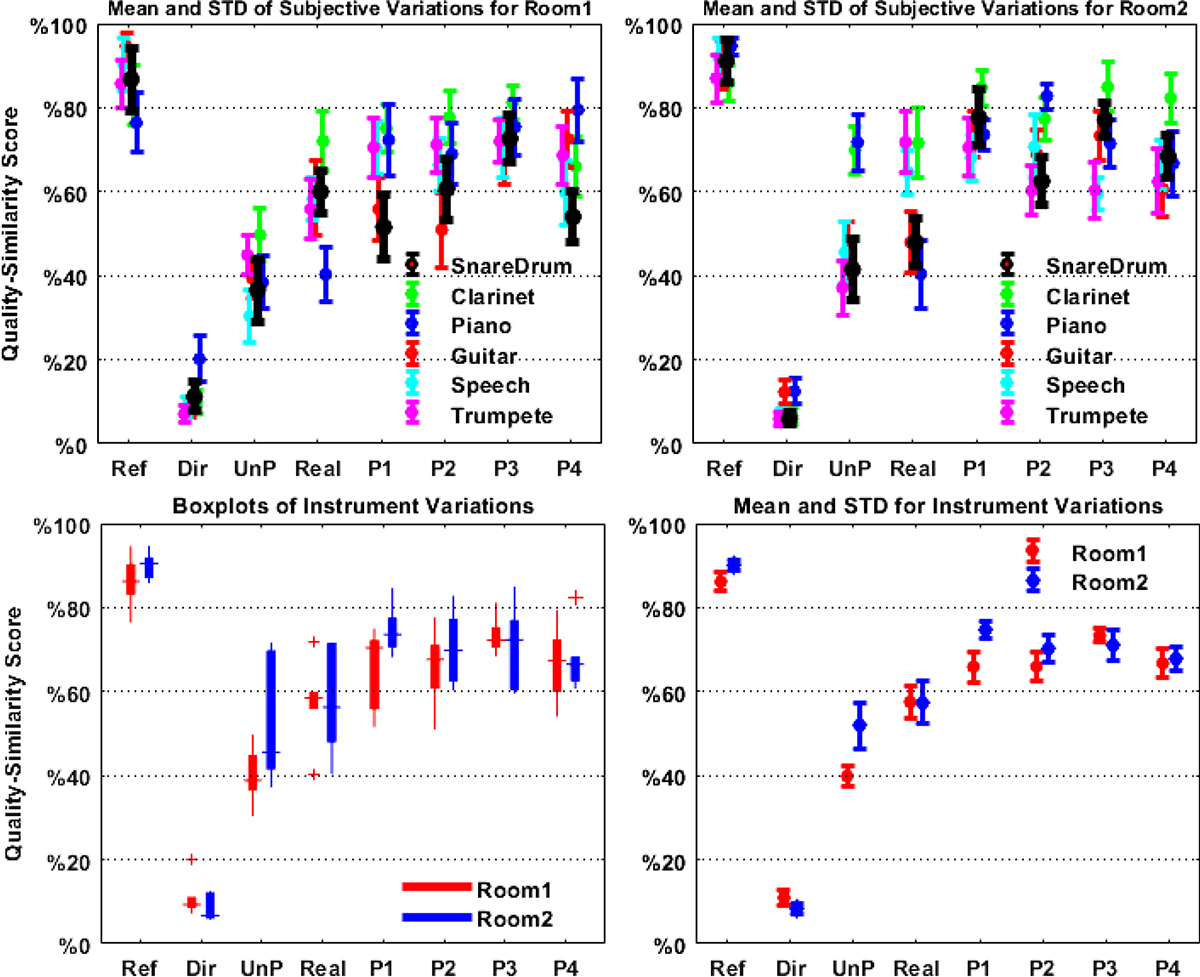
Results of the listening test evaluating general-quality similarity in two rooms. The mean scores and standard errors averaged across 13 subjects for each instrument in Room1 and Room2 are shown in the upper panels. In Room1, clear improvements are observed for all instruments when comparing processed cases (P1–P4) to unprocessed (UnP) signals. In Room2, improvements are also observed, except for the clarinet and piano. The lower-left panel displays boxplots showing variation across instruments, with medians, 25th and 75th percentiles, and outliers. The lower-right panel shows mean and standard errors across all instruments.
Current usage metrics show cumulative count of Article Views (full-text article views including HTML views, PDF and ePub downloads, according to the available data) and Abstracts Views on Vision4Press platform.
Data correspond to usage on the plateform after 2015. The current usage metrics is available 48-96 hours after online publication and is updated daily on week days.
Initial download of the metrics may take a while.