Figure 8
Download original image
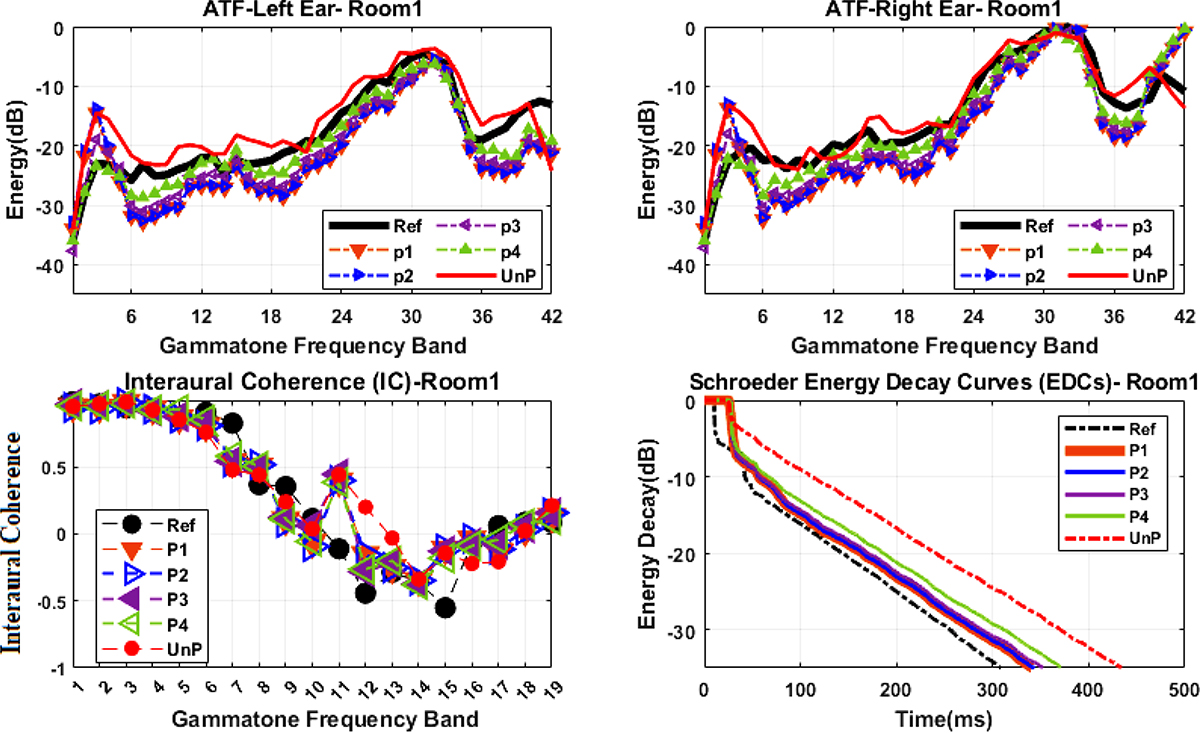
Comparisons of four processed versions of the ART method (P1, P2, P3, P4) with the reference (Ref) and the unprocessed (UnP) BRIRs in Room1. The two upper panels show the ATFs of BRIRs for Ref, UnP and processed BRIRs for the right and left ears. The lower-left panel illustrates the Interaural Coherence (IC) of the processed and UnP cases, along with their comparison to the reference BRIR for perceptually relevant frequencies below 1500 Hz. The lower-right panel shows the Schroeder energy decay curves (EDCs) of the BRIRs.
Current usage metrics show cumulative count of Article Views (full-text article views including HTML views, PDF and ePub downloads, according to the available data) and Abstracts Views on Vision4Press platform.
Data correspond to usage on the plateform after 2015. The current usage metrics is available 48-96 hours after online publication and is updated daily on week days.
Initial download of the metrics may take a while.