


Figure 10.
Download original image
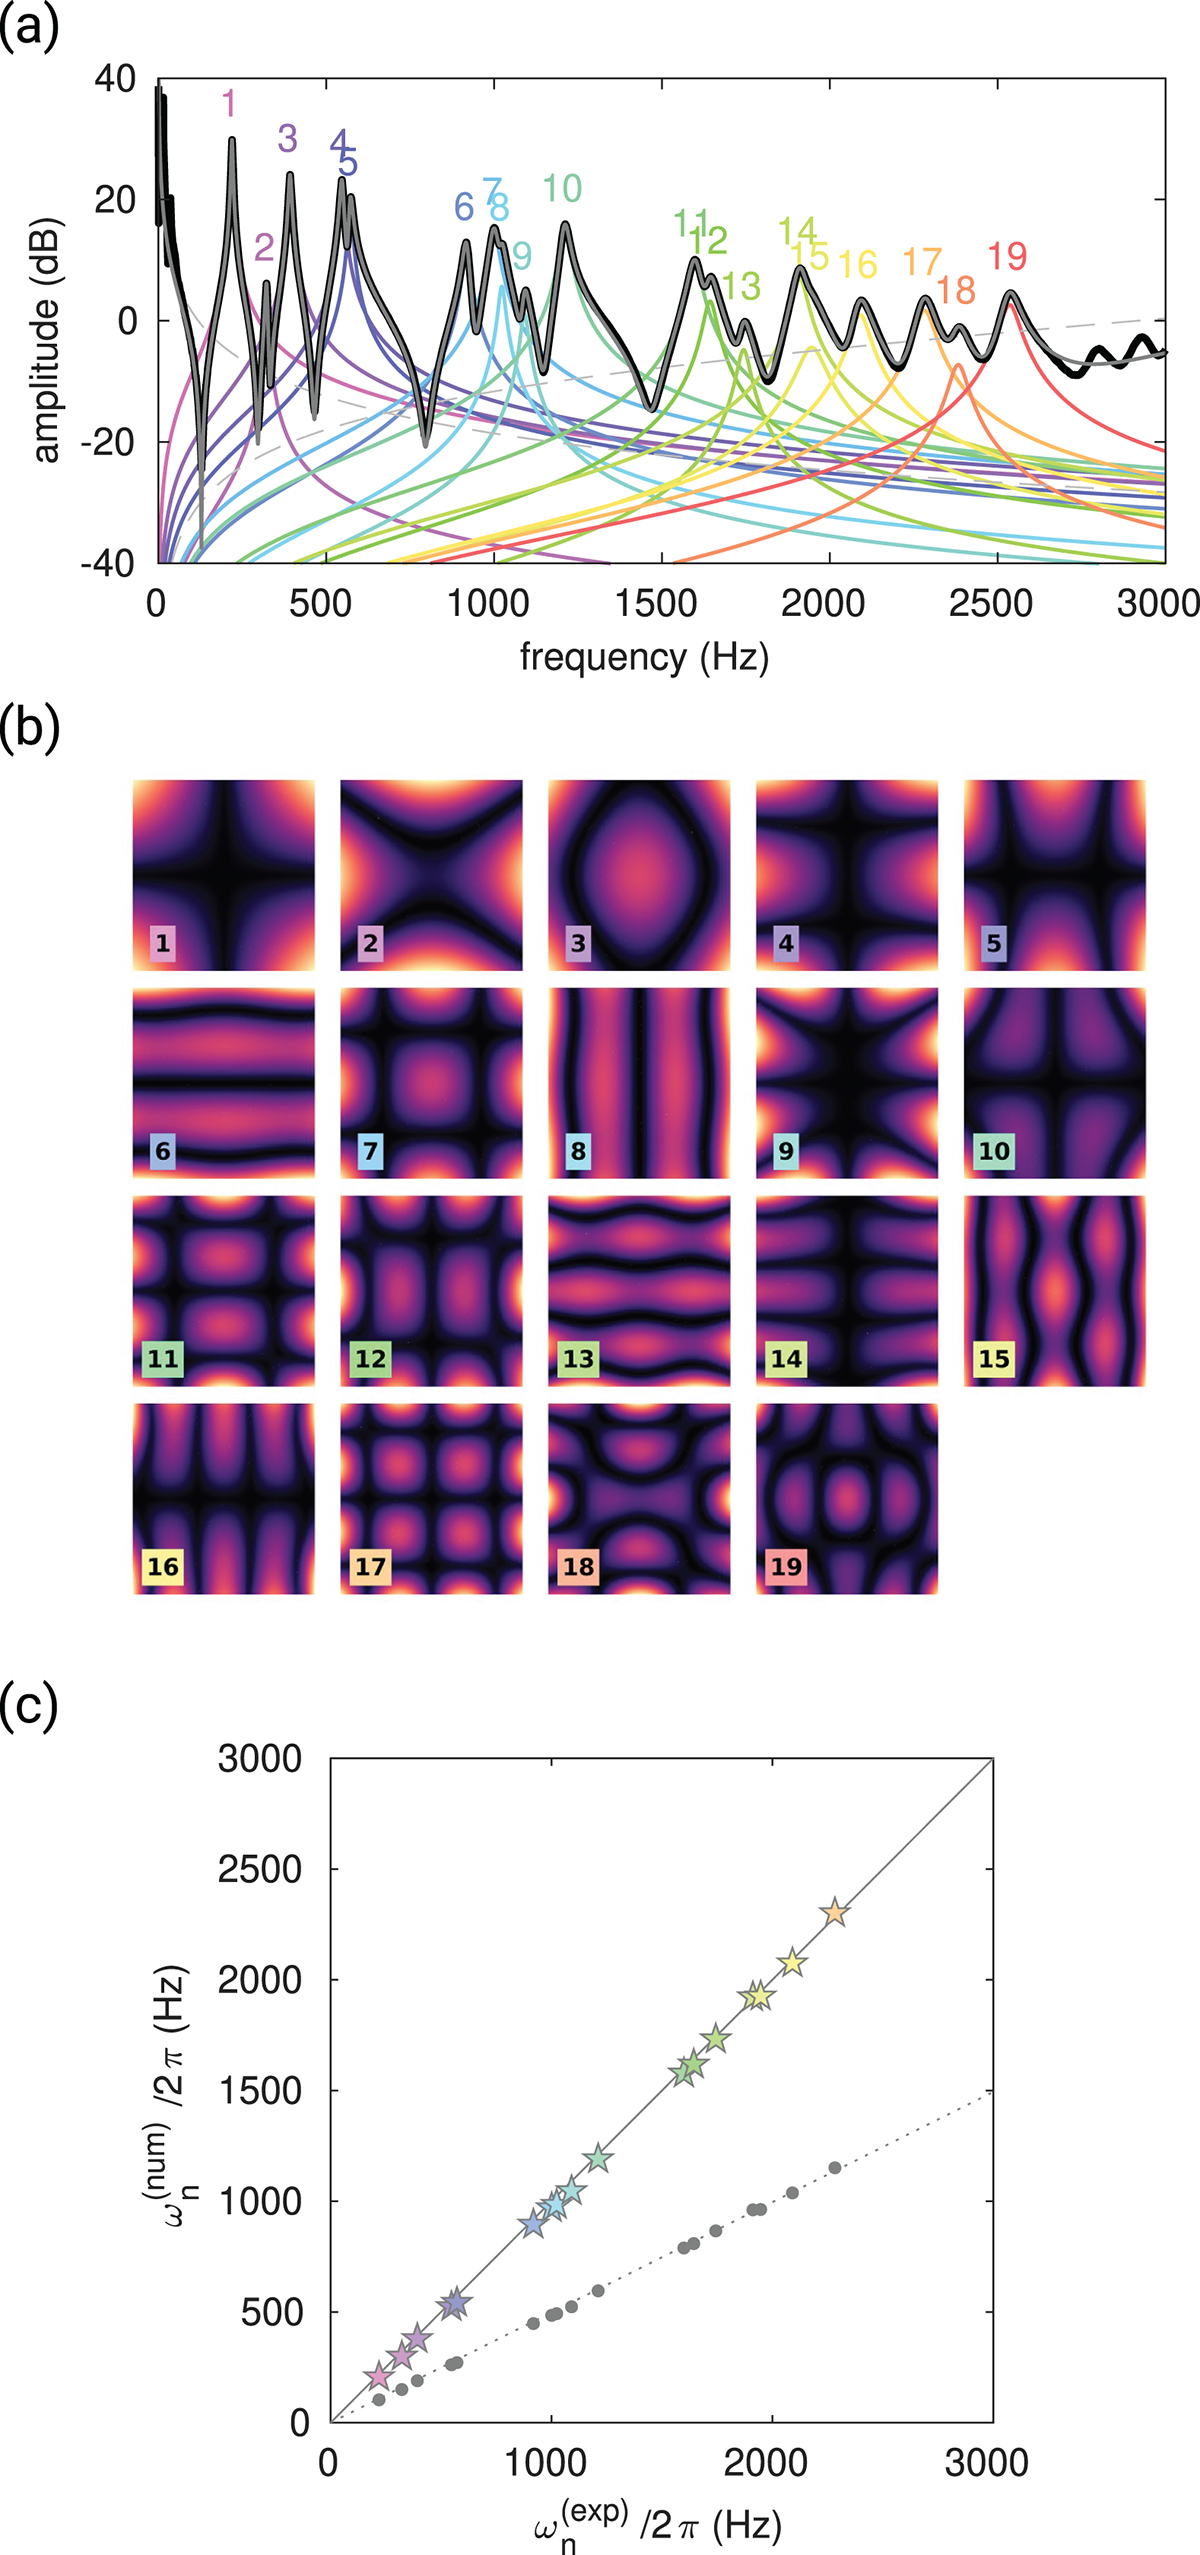
(a) Measured FRF (black) and reconstructed FRF (gray) using modal parameters identified with a frequency-domain method. The contribution of each mode is shown in color, along with the low-frequency and high-frequency residual terms (dashed lines). (b) Mode shapes computed using a finite element model. (c) Comparison between experimental and numerical natural frequencies before (dots) and after (stars) updating the Young’s modulus.
Current usage metrics show cumulative count of Article Views (full-text article views including HTML views, PDF and ePub downloads, according to the available data) and Abstracts Views on Vision4Press platform.
Data correspond to usage on the plateform after 2015. The current usage metrics is available 48-96 hours after online publication and is updated daily on week days.
Initial download of the metrics may take a while.