


Figure 7.
Download original image
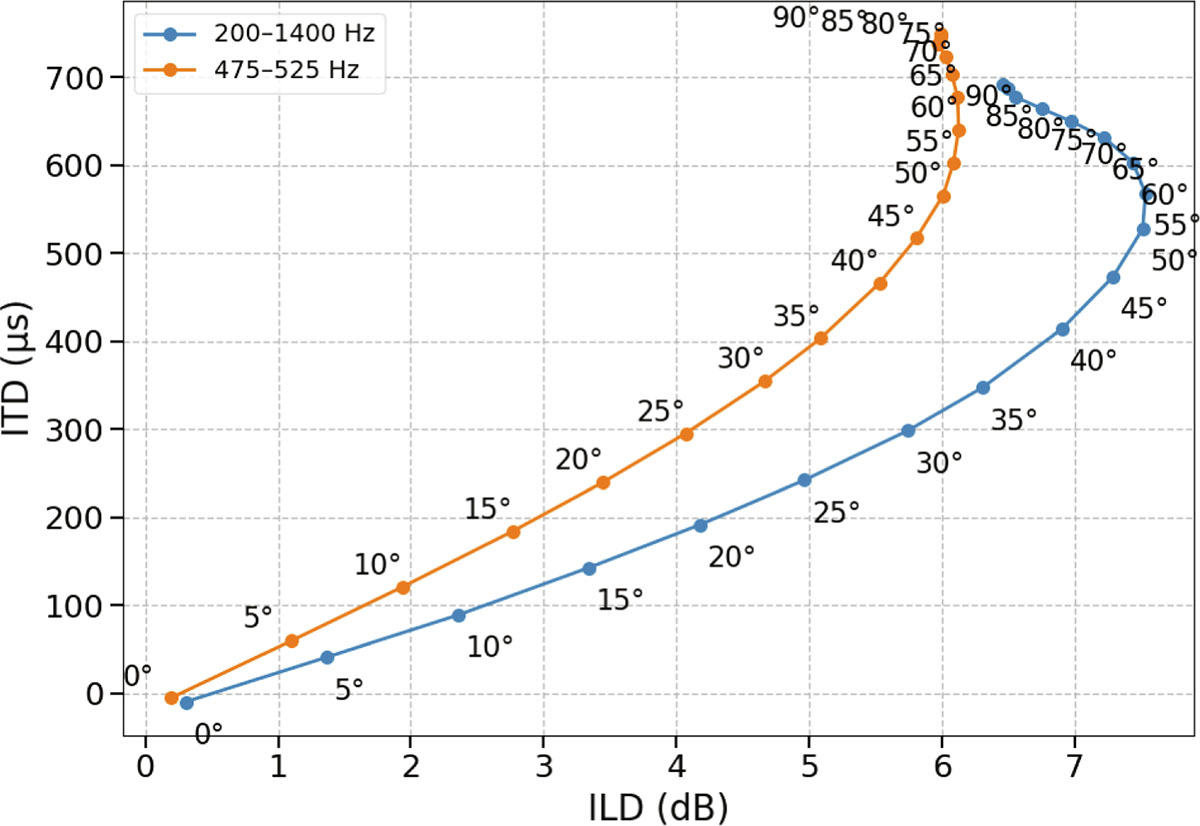
ILD–ITD extracted from KEMAR head measurements (SADIE database) for a rotating source located 1.5 m from the center of the head. ILDs were obtained from spectral level differences averaged over 200–1400 Hz (blue) and 475–525 Hz (orange), while ITDs were estimated from cross-correlation of band-limited impulse responses over the same frequency ranges. 90° denotes a source positioned at the side of the head.
Current usage metrics show cumulative count of Article Views (full-text article views including HTML views, PDF and ePub downloads, according to the available data) and Abstracts Views on Vision4Press platform.
Data correspond to usage on the plateform after 2015. The current usage metrics is available 48-96 hours after online publication and is updated daily on week days.
Initial download of the metrics may take a while.