| Issue |
Acta Acust.
Volume 6, 2022
|
|
|---|---|---|
| Article Number | 53 | |
| Number of page(s) | 18 | |
| Section | Hearing, Audiology and Psychoacoustics | |
| DOI | https://doi.org/10.1051/aacus/2022047 | |
| Published online | 16 November 2022 | |
Scientific Article
Parametric model of young infants’ eardrum and ear canal impedances supporting immittance measurement results. Part I: Development of the model
1
Institut für Hörtechnik und Audiologie, Jade Hochschule, Ofener Str. 16, 26121 Oldenburg, Germany
2
Acoustics Group, Carl von Ossietzky Universität Oldenburg, Carl-von-Ossietzky-Str. 9-11, 26129 Oldenburg, Germany
3
Cluster of Excellence “Hearing4All”
* Corresponding author: This email address is being protected from spambots. You need JavaScript enabled to view it.
Received:
21
April
2022
Accepted:
20
October
2022
Abstract
Wideband acoustic immitance (WAI) measurements provide an objective means to detect pathological middle ear conditions. However, for ears of young infants, it is still difficult to make clear statements about the middle ear status based on WAI measurements. In order to gain a better understanding of WAI data obtained in young infants’ ears, a parametric electro-acoustic model of the ear canal and the middle ear of young infants is proposed. In this first part of the two-part paper, the development of the model for the healthy ear is presented. Based on an existing model for adult ears, the presented model is adapted to young infants’ ears, uses parameters suited to represent physiological properties, and uses a smaller number of parameters in order to reduce model complexity. A comparison of the acoustic input impedance of the ear predicted by the model with real ear measurements in young infants’ ears showed a good agreement in the main characteristics. Model predictions show that the medium frequency range (about 1–3 kHz) of the acoustic input impedance of the ear is dominated by the properties of the eardrum and the middle ear, indicating that pathological middle ear conditions can preferably be detected in this frequency range.
Key words: Acoustic impedance / Admittance / Middle ear / Outer ear / Screening
© The Author(s), published by EDP Sciences, 2022
 This is an Open Access article distributed under the terms of the Creative Commons Attribution License (https://creativecommons.org/licenses/by/4.0), which permits unrestricted use, distribution, and reproduction in any medium, provided the original work is properly cited.
1 Introduction
Pathological middle ear conditions occur frequently in early infancy. In the first months of life, middle ear effusion, i.e. fluid in the middle ear resulting from otitis media, is the most frequent pathological middle ear condition. In [1] a prevalence of 74% for middle ear effusion was found for children in the first 6 months of life, and in [2] a prevalence of 47.8% was found for infants aged between 2 months and 6 months. Less frequent conditions are e.g. oedematous middle ear, negative pressure difference between middle ear and ear canal, and middle ear dysplasia. Besides treatments that may or may not be necessary as a result, such conditions also have consequences for diagnostic tests like those used within universal newborn hearing screening programs, because the sound has to travel through the middle ear in order to trigger a response. If an otoacoustic emissions test is applied, the middle ear has to be traveled even twice, first by the stimulus and second by the emission from the cochlea back to the ear canal. Such tests will also be affected by the non-pathological occurrence of amniotic fluid in the middle ear, typically present right after birth up to a few days.
Traditionally, tympanometry at a single frequency is used to detect pathological middle ear conditions. In the last years broadband immittance-based methods were investigated for their suitability and potential superiority in middle ear diagnostics. In this context the term immittance comprises the acoustic impedance, the acoustic admittance, as well as further measures derived from these quantities. The measures of these methods are grouped under the term “wideband acoustic immittance (WAI)”. In 2013 a consensus statement was formulated by several researchers in that field. It was concluded that WAI, as a tool to improve the diagnostics of middle ear disorders is very promising, however, further research is needed especially to increase the database for both, normative data and data for different pathologies [3].
Today, it is still difficult to make clear statements about the middle ear status of young infants based on WAI measurements. One important aspect is that middle ears of young infants exhibit different acousto-mechanical properties in comparison to older children and adults. Furthermore, WAI is based on acoustic measurements in the ear canal and it is known that, in the first months of life, the acoustic properties of the ear canal also significantly differ from those at an older age.
In order to gain a better understanding of WAI, knowledge about the impact of different factors like compliant ear canal walls, ear canal shape, and the healthy middle ear versus different pathological middle ear conditions on WAI-measures would be valuable. While some early WAI studies with young infants [4–8] report complex impedance/admittance data together with measures derived from this data, in many recent WAI studies with young infants the only immittance measure reported is either the energy reflectance or the energy absorbance [9–13]. Both require an assumption or estimation regarding the value of the tube wave impedance associated with the ear canal area at the probe tip, which is often not consistent over studies and measurement devices, making the results hard to compare. In addition, they neglect phase information which could potentially be useful to identify acousto-mechanical properties of the residual ear canal and its termination by the eardrum and the middle ear.
In order to be able to verify the suitability of WAI as a diagnostic tool for young infants, certainty of the middle ear status and measures which are independent of the particular measurement device being used are needed. It would be helpful to have detailed knowledge of the transfer of sound in the ear canal to the eardrum, and more specifically to the middle ear. Acousto-mechanical transfer models would provide such detailed knowledge. Many models of this kind have been proposed, e.g. [14–21], which, in general, share many properties but differ in details. The more recent models in particular are mostly further developments of the earlier models. However, they have been developed specifically for adults. Since it is known that several potentially relevant properties of the ear canal and the middle ear differ significantly between adults and young infants, they can in general not be used for young infants.
Therefore, in this paper, a parametric electro-acoustic model of the ear canal and the middle ear of young infants, to be used to predict the acoustic input impedance at the eardrum at ambient pressure, will be presented. The model is based on the model for adults according to [18–20] with the following aims of adaptation: (1) differences between infants’ and adults’ ears should be taken into account, (2) model parameters should be suited to represent physiological properties, and (3) model complexity in terms of the number parameters should be reduced. The adult model from [18–20] was chosen as a starting point because it proved useful in previous studies of the authors on the development of individualized models for the prediction of the sound pressure at the eardrum [22–24] and on the development of implantable middle-ear sensors [25]. It should be noted that in this study we use the same concept of the drum impedance as in [18–20, 26], i.e. the impedance seen when exciting the eardrum by a plane wave impinging perpendicularly onto the drum surface, whereas in many other studies, the drum impedance is referred to as the impedance at or shortly behind the entrance to the so-called drum coupling region, which in turn is composed of the inclined eardrum and the air space below it.
The objective of the present work is that the adapted model can be used to predict the ability of immittance-based measurements in the ear canal to detect certain different pathological middle ear conditions. Hence its focus is the sound transfer in the ear canal and the acoustic input impedance of the eardrum and not the transfer through the middle ear.
In a companion paper, the model will be extended to predict the influence of pathological middle ear conditions in young infants’ ears on the acoustic input impedance of the ear in order to investigate implications for WAI-measurements. A MATLAB-implementation of the complete model can be found in [27].
2 Development of the model
In the following, the proposed parametric electro-acoustic model of infants’ middle ears and ear canals is described. The parameters of this model are linked to physiological properties. The starting point of the development was the model of the ear canal and middle ear for adults according to [18], which was adapted to model infants’ ears. Furthermore, adaptations were made in order to reduce the model complexity by removing unimportant parameters. As will be explained in the following, reasons for parameters to be unimportant are (1) they are not needed for young infants’ ears, (2) they model effects which were not strongly supported by the available measurement data in [18], or (3) their influence on the resulting input impedance of the eardrum is small.
2.1 Existing parametric model of the ear for adults [18]
The transmission-line model proposed in [18] is depicted in Figure 1. It consists of the acoustic two-port C representing the ear canal, the acoustic impedance of the middle ear cavities Zcav, the acousto-mechanical kernel two-port K representing eardrum, malleus and incus, a mechanical admittance yis representing the incudostapedial joint, the mechano-acousical stapes two-port S and the mechanical admittance of the cochlea yc. Additionally the model includes a Thévenin-equivalent acoustic source with the source sound pressure ps and the source acoustic impedance Zs connected to the ear canal two-port. As can be seen in Figure 1, a topology-preserving analogy between electric, acoustic and mechanic domain was used, where electrical voltage corresponds to acoustical pressure p and mechanical velocity v. The electrical current corresponds to acoustical volume velocity q and mechanical force F.
 |
Figure 1 General model structure for sound transmission from the ear canal into the cochlea according to [18]. |
2.2 Adaptation of the parametric model to infants’ ears
2.2.1 Ear canal
In [18] it was proposed to model the ear canal by a stepped circular duct with rigid walls. The sound transmission of the duct is defined by the width Δi and the cross sectional area Ai of each slice i, and is given by
![Mathematical equation: $$ \left[\begin{array}{c}{p}_{\mathrm{ec}}\\ {q}_{\mathrm{ec}}\end{array}\right]=\left(\prod_i \left[\begin{array}{cc}\mathrm{cosh}({\gamma }_i{\Delta }_i)& \mathrm{sinh}({\gamma }_i{\Delta }_i){Z}_{\mathrm{tw}i}\\ \mathrm{sinh}({\gamma }_i{\Delta }_i)/{Z}_{\mathrm{tw}i}& \mathrm{cosh}({\gamma }_i{\Delta }_i)\end{array}\right]\right)\left[\begin{array}{cc}1& 0\\ 1/{Z}_{\mathrm{t}}& 1\end{array}\right]\left[\genfrac{}{}{0pt}{}{{p}_{\mathrm{D}}}{{q}_{\mathrm{D}}}\right], $$](/articles/aacus/full_html/2022/01/aacus220029/aacus220029-eq1.gif) (1)
(1)
with γ the propagation constant, Ztw the wave impedance, both depending on the cross-sectional area A, and with Zt the impedance of the tapered end of the ear canal between the points D and T, see Figure 2. Both γi and Ztwi were computed according to [28], considering thermal and viscous losses for smooth wall surfaces, resulting in a complex tube wave impedance and a complex propagation constant with a real part α and an imaginary part β. In [19] it was proposed to increase the damping (i.e. the real part of the propagation constant) according to
 (2)
(2)
with g = 3 to account for non-smooth ear canal walls. The value of g was directly taken from [19] where it was estimated from reflectance measurements of rigidly terminated cadaver ear canal slices. The wave impedance is then approximated by
 (3)
(3)
with ρ the mass density of air and c the speed of sound.
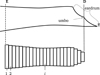 |
Figure 2 Sketch of the ear canal slice model showing the ear canal entrance E, the definition of the drum area D and the termination point T. |
This model implies the first azimuthal mode being outside the relevant frequency range, the sound pressure at the umbo producing the most relevant contribution to the force acting on the manubrium, and rigid ear canal walls.
Physiological differences between adults’ and infants’ ear canals considered for our adaptation are the smaller dimensions and the much more compliant ear canal walls [29, 30]. From birth up to an age of 6 months, the typical distance from the tragus to the innermost point at the eardrum ranges from 21 mm to 26.1 mm [4, 31, 32]. The depth of the concha was reported to be between 7 mm and 8.6 mm in [31], resulting in an ear canal length ranging from 14 mm to 17.5 mm. In comparison, for adults a mean value of 23 mm ear canal length was reported in [4]. The mean ear canal diameter for infants up to an age of 6 months ranges from 4.4 mm to 6.3 mm, see [4]. For adults, a value of 10.4 mm diameter was reported in [4]. It should be noted, that the mentioned values of ear canal geometry from [4, 31, 32] were determined from acoustic measurements with the underlying assumption of a cylindrical ear canal with rigid termination.
The walls of the ear canal are much softer and more flexible in young infants than in adults, see e.g. [33]. In [4] a resonant behavior of ear canal walls was found up to an age of 6 months. In order to consider the softer ear canal walls in the model, we propose to introduce a wall impedance
 (4)
(4)
for every ear canal slice i with the wall resistance Ww, the acoustic mass Mw and the wall compliance Nw. Both the acoustic mass and the compliance are determined by the properties of the soft tissue in the ear canal, as
 (5)
(5)
 (6)
(6)
with ρst the density, dst the thickness, Ast the surface area, and Est the Young’s modulus of the soft tissue. The damping is modeled with a frequency independent damping ratio given by
 (7)
(7)
For the damping constants α and β it is assumed that α + ω = βω. The frequency-dependent wall resistance is then given by
 (8)
(8)
The proposed modeling of the damping is motivated by the work in [34] in which a finite-element model of the ear canal and middle ear of a 22 days old infant was proposed. In [34], three sets of values were given for the ear canal wall parameters Est, ρst and ζst. The three sets, referred to as low impedance, baseline and high impedance, were chosen to cover a realistic range of values. The values given were Est: 20 kPa, 210 kPa and 400 kPa, ρst: 1000 kg/m3, 1100 kg/m3 and 1200 kg/m3, ζst: 0.1, 0.25 and 0.4. No values were given in [34] for the thickness dst and the area Ast of the soft tissue in the ear canal. In order to reproduce the modeling results of the ear canal wall impedance Zw in [34], we adopt the values of Est and ρst. For the damping ratio ζst modified values of 0.5, 0.6, 0.9 are used. The thickness dst is assumed to be 3 mm and the area Ast is assumed to be 119 mm2 (the lateral surface of a cylinder with a radius of 1.9 mm and a length of 10 mm). The acoustic wall admittances Yw = 1/Zw resulting from equation (4) for the three sets of values are depicted as straight lines in Figure 3 together with the modeling results from [34, Fig. 6] depicted as open circles. Additionally the acoustic admittance of the air enclosed in the canal is depicted in black. Note that in [34] a weighting of the damping constants α and β wasn’t mentioned, however, the positive phase values at the resonant frequency of Yw of their results indicate that they used a damping model which was dominated by mass rather than by compliance (α/ω > βω). In order to reproduce this effect in Figure 3 a weighting of  is applied. For the model we propose here, a damping ratio ζst of 0.6 was chosen which leads to modeling results comparable to those in [34] for their baseline set, see Figure 3. Since no reason could be found that the damping is either dominated by mass or by compliance, α/ω = βω is used in the model proposed here. It should be noted that the choice of a particular damping model is not critical with respect to the resulting immittance values, see discussion in Appendix A.1.
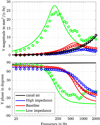 |
Figure 3 Reproduction of the modeling results in [34] of the ear canal wall admittance and admittance of the air in the canal using equation (4). The circles correspond to [34, Fig. 6] and the lines correspond to equation (4) using values of ρst = {1000 kg/m3, 1100 kg/m3 and 1200 kg/m3}, dst = 3 mm, Ast = 119 mm2, Est = {20 kPa, 210 kPa and 400 kPa}, ζst = {0.1, 0.25 and 0.4}, and |

In order to account for the effect of the soft ear canal walls in the sound transmission equation (1) changes to
![Mathematical equation: $$ \left[\begin{array}{c}{p}_{\mathrm{ec}}\\ {q}_{\mathrm{ec}}\end{array}\right]=\left(\prod_i \left(\left[\begin{array}{cc}\mathrm{cosh}({\gamma }_i{\Delta }_i)& \mathrm{sinh}({\gamma }_i{\Delta }_i){Z}_{\mathrm{tw}i}\\ \mathrm{sinh}({\gamma }_i{\Delta }_i)/{Z}_{\mathrm{tw}i}& \mathrm{cosh}({\gamma }_i{\Delta }_i)\end{array}\right]\left[\begin{array}{cc}1& 0\\ 1/{Z}_{\mathrm{w},i}& 1\end{array}\right]\right)\right)\left[\begin{array}{cc}1& 0\\ 1/{Z}_{\mathrm{t}}& 1\end{array}\right]\left[\genfrac{}{}{0pt}{}{{p}_{\mathrm{D}}}{{q}_{\mathrm{D}}}\right]. $$](/articles/aacus/full_html/2022/01/aacus220029/aacus220029-eq10.gif) (9)
(9)
In comparison to models with rigid ear canal walls, the inclusion of the effects of soft ear canal walls will mainly affect frequencies below about 1.5 kHz, see discussion in Section 4 (Fig. 10).
2.2.2 Middle ear cavities
The middle ear cavities comprise the tympanic cavity, the aditus ad antrum, the antrum and the mastoid air cells. They are represented by the acoustic impedance Zcav located between the ear canal two-port and the eardrum within the kernel two-port, see Figure 1. Generally, cavities are modeled using acoustic compliances representing volumes, acoustic masses representing air columns and resistive components introducing damping. The model of Zcav for adults according to [18] is depicted in Figure 4. It contains the compliance Ntcav and the resistance Wtcav of the tympanic cavity, the acoustic mass Mada and the resistance Wada of the aditus ad antrum, the compliance Nant of the antrum and the acoustic impedance Zmac of the mastoid air cells.
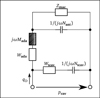 |
Figure 4 Equivalent circuit of the middle ear cavities model. The value of the impedance Zcav results from the pressure pcav divided by the volume velocity at the eardrum qD. |
With the acoustic compliance of a volume V given by N = V/(ρc2), the resulting acoustic impedance of the middle ear cavities becomes
 (10)
(10)
The acoustic impedance Zmac of the mastoid air cells was modeled as a series resonant circuit in [18], defined by its resonant frequency fmac, its quality factor Qmac and its acoustic compliance Nmac associated with the volume Vmac of the air cells,
 (11)
(11)
Significant physiological differences in young infant’s middle ear cavities, compared to those of adults, can be found in the sizes of the tympanic cavity and the antrum and in the status of pneumatization in the mastoid. In [35] the volume of the tympanic cavity was compared between infants aged ≤1 year and adults. It was found that the average infant’s volume is about 2/3 of the volume in adults (450 mm3/640 mm3). The volume of all middle ear cavities of a 22 days old middle ear was estimated from CT-scans in [36]. The overall volume was estimated to be between 730 mm3 and 930 mm3, with a volume of the tympanic cavity alone of 330 mm3. In the adult’s model, a value of 500 mm3 was used for the tympanic cavity volume and a value of 800 mm3 was used for the antrum [20]. Based on this, values of 330 mm3 for the tympanic cavity and 500 mm3 for the antrum were chosen for young infants in the present model.
According to [37, p. 107] pneumatization of the mastoid starts at the 33rd week of gestation. Starting with very few air cells in the mastoid, the surface of the antrum has an average value of 1 cm2 at birth. In the first year of life, the surface increases due to the pneumatization to 4 cm2. In contrast, the mean adult mastoid air cell surface is about 12 cm2. Because of the weak degree of pneumatization of the mastoid in young infant, the effect is omitted in the model, i.e. Zmac was removed from the model.
Furthermore, an additional modification in modeling the middle ear cavities is made. As will be shown in Section 3, the influence of the components modeling the aditus ad antrum on the acoustic input impedance at the eardrum of the infant model is small. In order to reduce the overall complexity of the model, these components (namely Wada and Mada) were omitted.
The resulting model of the middle ear cavities for young infants is depicted in Figure 5.
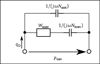 |
Figure 5 Equivalent circuit of the adapted middle ear cavities model. The value of the acoustic impedance Zcav results from the pressure pcav divided by the volume velocity at the eardrum qD. |
2.2.3 Eardrum, malleus and incus
In [18] the eardrum, the malleus and the incus were aggregated in the kernel two-port, see Figure 1. The kernel comprises the acoustic properties, the transformation from the acoustical to the mechanical domain and the mechanical properties of eardrum, malleus and incus. The equivalent circuit of the kernel is depicted in Figure 6 with the acoustic properties represented by the eardrum acoustic shunt impedance Zac on the left side. The two-port in the center models the acousto-mechanical transformation with the effective area AD of the eardrum. On the right side, the mechanical properties are modeled by the mechanical admittances of the eardrum yd, the malleus ym, the incudomallear joint ymi and the incus yi.
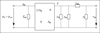 |
Figure 6 Equivalent circuit of the middle ear kernel two-port comprising the components of eardrum, malleus and incus according to [19]. |
The eardrum acoustic shunt impedance Zac was modeled as a series resonator with an additional correction of the phase. The resonator consists of a frequency independent acoustic resistance Wac and a compliance Nac, and an acoustic mass Mac increasing with frequency, given by
 (12)
(12)
with the acoustic mass Mac0 at f = 0 Hz and the characteristic frequency fYm. The eardrum acoustic shunt impedance was given as
 (13)
(13)
where
 (14)
(14)
is a phase correction with slope sYph and cut-off frequency fYph.
In the mechanical part, the admittance of the incudomallear joint was defined as
 (15)
(15)
with the mechanical resistance wmi and the mechanical compliance nmi. The values of the other three mechanical admittances were determined from a common mechanical admittance ydmi of eardrum, malleus and incus. The modeling of the admittance ydmi is depicted in Figure 7. Herein, noss and moss are the mechanical compliance and mass of the ossicles, and wfree and mfree are the mechanical resistance and mass of the free vibrating part of the eardrum. The coupling between the ossicles and the free vibrating part of the eardrum is represented by the mechanical compliance ncpl and resistance wcpl. The mechanical admittance of the incus were then determined using
 (16)
(16)
and the mechanical admittance of the eardrum and the malleus using
 (17)
(17)
according to [20].
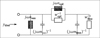 |
Figure 7 Equivalent circuit of the common mechanical admittance ydmi comprising parts of the eardrum, the malleus and the incus. |
The acoustical to mechanical transformation as described in [19] is achieved by a gyrator two-port with a frequency-dependent, complex-valued effective eardrum area AD. Specifically, AD is given by a second order low-pass filter  with an additional correction term ΦA for the phase at higher frequencies, resulting in
 (18)
(18)
The low-pass filter was defined as
 (19)
(19)
with the eardrum area A0 at low frequencies ω, the area A∞ for frequencies ω → ∞, the low-pass resonant frequency fA and the low-pass quality factor QA. The phase correction term was defined as
 (20)
(20)
with the slope sAph, the cut-off frequency fAph and the phase angle of  at fAph
  .
.
In the present modeling approach, besides modifications that pertain to differences between infants and adults, two simplifications were made that are not related to differences between infants and adults. First, in [19], the parameters used to model the eardrum acoustic shunt impedance were derived from acoustic measurements, but they were not directly related to physiological properties. As explained above, basically a series resonator was used to model Zac, with a phase correction term comprising 3 additional parameters used to modify the impedance at high frequencies. The first one, fYm, causes a steeper slope of the acoustic impedance. The other two parameters, sYph and fYph, change the phase response from approaching −90° at high frequencies to positive phase values. A similar effect as caused by these three parameters can occur if an additional acoustic mass, acting in parallel to the resonator, e.g. a small air column between the acoustic impedance measurement device and the object to be measured, is introduced. In [19] the authors themselves remark that their measurement results are questionable at high frequencies (10 kHz). They explicitly refer to a minimum in the measured acoustic admittance (1/Zac) which is not considered in their model. However, it would then be consequent to ignore the phase increase as well. Therefore, in the present approach, the phase correction term is omitted. Thus equation (13) simplifies to
 (21)
(21)
Note that all parameters in equation (21) (Wac, Mac and Nac) have values which do not depend on frequency. In order to be able to adapt at least the acoustic mass and the acoustic compliance to physiological conditions, the model of a stretched circular membrane according to [38, pp. 71, 225–226] is used. The acoustic compliance is then given by
 (22)
(22)
with aed the radius of the eardrum, T0,ed the eardrum tension and hed the thickness of the eardrum. The acoustic mass is given by
 (23)
(23)
with ρed the membrane mass density.
The second simplification not related to differences between infants and adults is made in the effective eardrum area AD. As will be shown in Section 3, the influence of the three parameters high frequency eardrum area (A∞), slope of the phase correction term (sAph) and cut-off frequency of the phase correction term (fAph) on the resulting acoustical eardrum impedance ZD is very small. In order to reduce the overall complexity of the model, these parameters are omitted. The simplified effective eardrum area is then given by
 (24)
(24)
Physiological differences of the eardrum between young infants and adults were reported in [39]. It was found that the thickness of the pars flaccida (Shrapnell’s Membrane) decreases with age, mainly during the first year of life. At an age of about 4 month the pars flaccida is about 3 times thicker compared to the thickness at an age of 21 years. Assuming the area of the pars flaccida is about 0.2 of the overall eardrum area, the parameters of acoustic and mechanic masses of the eardrum are multiplied by a factor of 3 · 0.2 + 0.8 = 1.4. According to equation (22), the acoustic compliance Nac is inversely proportional to the thickness of the membrane and is therefore divided by 1.4.
Age-related changes of the ossicles were reported in [40], where the average weight of malleus and incus is roughly 25% higher in adults than in the age group from 0 to 10 months. Since a reduction of the ossicles’ mechanical mass in the model by 25% has almost no effect on the acoustical eardrum impedance, this age-related difference is neglected.
There are some parameters in the model for which a direct physiological link is not obvious. This applies to the damping and to the low-pass used to model the effective eardrum area. By comparing the acoustic impedance predicted by the model with impedances measured in infant’s ear canals from [41], it was found that an adaption of three more parameters was necessary. Firstly, the resistance Wac of the eardrum acoustic shunt impedance was reduced by a factor of 0.7, secondly, the low-pass resonant frequency fA of the effective eardrum area was increased by a factor of 2 and thirdly, the quality factor QA of the effective eardrum area was reduced to 1.
2.2.4 Stapes and cochlea
In [18] the stapes and the cochlea were represented by the mechanical admittance of the stapes ySt and the acoustic input impedance of the cochlea ZC. Both were modeled by simple vibrators. The mechanical admittance of the stapes was given by
 (25)
(25)
and the acoustic input impedance of the cochlea was given by
 (26)
(26)
with the respective mechanical elements resistance w, compliance n and mass m and with the area of the stapes footplate AStF. The compliant element of ySt represents the annular ligament and the compliant element of ZC is mainly caused by the round window membrane, see [20].
To our knowledge no physiological differences in stapes and cochlea input between infants and adults have been reported in literature. Therefore, we propose to retain the original model from [18] for this part of the overall model. However, it should be mentioned that in [29] it was stated that the developmental changes in the size of the middle ear cavities may be associated with a change in ossicular orientation.
3 Effect of proposed model adaptations on the eardrum impedance
In the previous section, several adaptations were proposed with respect to the model according to [18]. In this section, the impact of the outlined adaptations on the acoustic impedance at the eardrum ZD will be shown.
As discussed in Section 2.2.3, the high-frequency eardrum area A∞, the slope of the phase correction term sAph and the cut-off frequency of the phase correction term fAph were proposed to be omitted in order to reduce the overall model complexity. As can be seen in Figure 8, by comparing the eardrum impedance of the original model (blue lines) with the red lines, the difference is indeed small and limited to the frequency range between 2 and 4 kHz.
In Section 2.2.3 it was proposed to omit the parameters fYm, fYph and sYph manipulating the acoustic impedance Zac at high frequencies. The resulting eardrum impedance is depicted in Figure 8 (yellow line) including the previously mentioned simplifications. As can be seen, there is a significant difference in both, magnitude and phase of ZD. The reason for omitting these parameters was that they were not strongly supported by the available data in [18], see Section 2.2.3. In fact, the high frequency behavior of our proposed model is similar to that presented in [42], in which a simple network-model of the middle ear was fitted to the occluded-ear simulator transfer impedance as defined in [43].
In Figure 9, the eardrum impedances ZD of the adult model according to [20] (blue line), and of the model adapted to infants’ ears (red line) are depicted. As can be seen, the most prominent difference is a shift of the global minimum in the magnitude from 800 Hz (adults) to about 2 kHz (infants) with a corresponding shift of the first zero crossing frequency in the impedance phase. Additionally, the eardrum impedance of the infants’ model, extended by the model components of the aditus ad antrum, namely Mada and Wada, is depicted (yellow line). Since there are no known values for infant ears for Mada and Wada, the values of the adults model were used. It can be seen that the impact on ZD is not very strong and mostly limited to a narrow frequency band around 5 kHz, which supports the omission of these parameters.
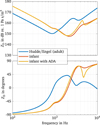 |
Figure 9 Eardrum impedances of the model according to [20], the model adapted to infants, and additionally the infant model extended by the model components of the aditus ad antrum (ADA). |
4 Ear canal impedance of the proposed model
To give insight into how the ear canal impedance Zec, which is the quantity measured in a WAI-measurement, of the newly proposed model for infants differs from the original model according to [18] for adults, some exemplary results are shown in Figure 10. For both, infant and adult, the ear canal is modeled assuming a constant cross section. Using the values of ear canal geometry given in Section 2.2.1 with a probe insertion depth of 5 mm, which has to be subtracted from the ear canal lengths, for the infant’s ear canal a length of 11 mm and a radius of 2.7 mm is assumed while for the adults’ ear canal a length of 18 mm and a radius of 5.2 mm is assumed. In addition to the ear canal impedance of the infant’s model (Zec, infant) the impedance of the same model neglecting the effect of compliant ear canal walls (Zec,infant rigid ec walls) is shown.
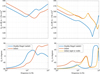 |
Figure 10 Eardrum impedances ZD (left) and input impedances of the ear Zec (right) resulting from the model according to [20] and our model adapted to infant's ears. |
By comparing the ear canal impedances of the infants’ model with and without compliant walls, it can be seen that the effect of compliant ear canal walls reduces the magnitude by several dB up to about 500 Hz. A substantial difference in the phase of Zec can be seen up to about 1.5 kHz. At higher frequencies, the effect of compliant ear canal walls can be ignored, provided our proposed model is valid.
A comparison of Zec with ZD shows for the adult model that the magnitude of the eardrum impedance ZD is high compared to that of the ear canal impedance. For the infant model, this is only true at frequencies up to about 1 kHz and above about 4 kHz. Conversely, between about 1.5 kHz and 3 kHz, Zec is governed by ZD.
In Figure 11, the effect of varying either the ear canal radius (left) or the ear canal length (right) by ±50% can be seen. In both cases the ear canal volume varies, resulting in an increased low-frequency impedance magnitude with decreased volume. While a decreasing ear canal radius increases the impedance magnitude at higher frequencies, too, a decreasing ear canal length shifts the local extrema to higher frequencies.
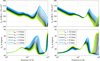 |
Figure 11 Ear canal impedances Zec resulting from our model adapted to infant's ears for different ear canal radii (left) and different ear canal lengths (right). |
The effects of varying the parameters modeling the compliant ear canal walls by ±50% on the ear canal impedance Zec are depicted in Figure 12. As already seen above, substantial differences in Zec are restricted to frequencies below about 1.5 kHz. As can be seen on the left side, increasing Young’s modulus Est shifts the magnitude minimum and the phase maximum to higher frequencies. As expected, increasing the damping ratio ζst results in a shallower magnitude minimum and phase maximum. On the right side it can be seen that increasing the thickness dst shifts the magnitude minimum and the phase maximum to lower frequencies.
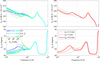 |
Figure 12 Ear canal impedances Zec resulting from the model adapted to infant's ears for different values of the parameters modeling the compliant ear canal walls. |
In summary, for the infant ear, the main characteristics of the ear canal impedance Zec and their underlying structures are as follows: At frequencies below about 1 kHz, the compliance of the air volume resulting from the ear canal geometry, together with the compliant ear canal walls and the compliant eardrum, determine the level of the magnitude. Additionally, the vibrating ear canal walls cause a magnitude minimum or plateau and a maximum in phase around 400–700 Hz. Around 1.8 kHz, the acoustic input impedance at the eardrum causes a magnitude minimum with a phase increasing with frequency. At high frequencies above about 3 kHz, the ear canal geometry causes a magnitude minimum with a phase increasing with frequency.
5 Experimental validation
In this section, the model predictions of the ear canal impedance will be compared with measurements published in [41]. As described in [41], the measurement method is based on [44], extended by consideration of discontinuity and end corrections in [22]. The method including the calibration procedure is described in detail in [22]. The measurements were performed using a custom-made impedance probe to measure the ear canal impedance on infant ears. The probe was designed to avoid over-pressure in the ear canal caused by inserting it into the ear canal at the cost of a decreased signal-to-noise ratio (SNR) at frequencies below about 1 kHz, further details can be found in [41]. This was realized by a pressure equalizing duct with an inner diameter of 0.6 mm. The subjects who participated in the study were aged between 2 weeks and 5 months. It should be noted that the infant ear undergoes developmental changes within the age range of the participants, i.e. an age-related effect is contained in the measurement data. The middle ear status of the participants was assessed by ENT-doctors specialized in pediatric audiology to be either normal, pathological or unclear at the time of testing. The assessment was based on the results of 1 kHz tympanometry, OAE- and/or AABR-screening, and ear-microscopy, see again [41] for details. Note that in the following only the measurement data of the ears assessed to have a normal middle ear status are used. This comprised 30 ears from 24 infants in total.
In Figure 13, the measured ear canal impedances of 30 ears (pale colored lines), the modeled ear canal impedance, again using a constant ear canal cross section with 11 mm length and 2.7 mm radius (dashed black line) are depicted. Additionally, the modeled ear canal impedance using a constant ear canal cross section with 14 mm length and 1.7 mm radius is depicted (straight black line). All default parameter values used for the predictions are given in Appendix A.2. Since the impedance measurements in [41] suffer from a bad SNR at low frequencies, due to noise generated by the subject during the measurement, only those impedance values are depicted in which the coherence between the signal applied to the probe speaker and the signal sensed by the probe microphone exceeded 0.5. Another effect that appeared in some measurements was acoustic leakage, which can be seen by phase values around 0 or larger below about 1 kHz. Although it would be easily possible to incorporate acoustic leakage into the model, this wasn’t done here in order not to increase the number of parameters further.
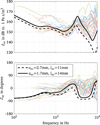 |
Figure 13 Ear canal impedance resulting from the model using two different sets of ear canal radius and diameter (black lines) together with ear canal impedances measured in N = 30 infant ears from [41] (pale colored lines). |
Comparing the ear canal impedance (dashed line) of the model (using aec = 2.7 mm and lec = 11 mm) with those of the measurements, Figure 13 shows that the overall course of the impedance, with its main characteristics, is in agreement in both, magnitude and phase. At low frequencies up to about 1 kHz, the effect of compliant ear canal walls as described in Section 4 can be seen in several measurements. The first minimum of the impedance magnitude at about 1.8 kHz is also present in the measurements, however, most measurements have a larger value compared to the model. Model and measurements have a phase increasing with frequency between 1.2 kHz and 2.4 kHz, but in the model, the slope of the phase is smaller compared to the measurements. At higher frequencies, inter-individual differences in the measurements are quite large, but a significant difference between the measurements and the model is that the minimum in the impedance magnitude of the model is much steeper and the phase between about 2.5 kHz and 8 kHz lie below the measurements.
The high-frequency-minimum in the impedance magnitude is only caused by the ear canal dimensions, as can be seen in Figure 11. If the ear canal geometry is slightly changed, the agreement between model and measurement can be significantly increased. Zec, depicted as straight line in Figure 13, is modeled with an ear canal radius of 1.7 mm and an ear canal length of 14 mm. As can be seen, the agreement with the measurements is much better at high frequencies and, furthermore, also between 1.2 kHz and 2.4 kHz, in both magnitude and phase. However, between 3.5 kHz and 7 kHz, the model phase still lies below the measurements.
6 Influence of ear canal shape
So far, for all calculations of the impedance Zec, a cylindrical ear canal shape was assumed. As described in Section 2.2.1, it is also possible to compute Zec for varying cross-sectional area functions of the ear canal. In Figure 14 the impedance of the ear Zec is depicted for three different ear canal shapes chosen to cover the range of possible shapes. From lateral to medial these shapes are: a cylindrical canal, a canal with linearly decreasing cross-sectional area, and a canal with linearly increasing cross-sectional area. All ear canals have the same volume and the same length.
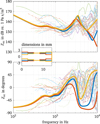 |
Figure 14 Input impedances of the ear Zec resulting from the model adapted to infant's ears for different ear canal shapes while preserving ear canal volume and length, together with ear canal impedances measured in infants ears with normal middle ear from [41]. |
As can be seen, compared to the cylindrical canal, a conical shape with decreasing cross-sectional area shifts the magnitude minimum to higher frequencies. If the cross-sectional area increases, the minimum is shifted to lower frequencies.
Changes in the ear canal shape without changing the ear canal volume mainly affect Zec at high frequencies. In the medium frequency range where Zec is dominated by ZD, only a small effect can be observed for the magnitude and a slightly larger effect can be observed for the phase of Zec in the 2–3 kHz frequency range. Real ear canals will differ from the model by shapes that deviate from circular cross sections and by curvature. The effects shown above indicate that real ear canal shapes will have a strong influence on Zec at high frequencies, but at medium frequencies below about 3 kHz the influence on Zec will be rather small.
7 Comparison to similar models
One of the first models considering the effect of soft and flexible ear canal walls of young infants on WAI-measurements was proposed in [4]. In that study, the authors presented measurement-based acoustic input impedances for different age groups. They used an electro-acoustic approach to model the acoustic input impedance Zec for the age group of 1 month in the frequency range from 125 Hz to 2 kHz. The ear canal walls were represented by a resonator with fixed values of the resonant frequency (f0 = 450 Hz), the quality factor (Q = 2), and the compliance of the wall (Nw = 1.6 · 10−12 m3/(Pa s)). Compared to the model of the present study, provided that comparable ear canal dimensions are used, the effect of the ear canal wall on Zec is very similar at frequencies below the resonant frequency, see Figure 15. At higher frequencies, there are larger differences, mostly because at these frequencies the acoustic input impedance at the eardrum ZD becomes dominant, which has a smaller magnitude in the present model. In contrast to the present modeling approach, beside being restricted to frequencies below 2 kHz, in [4] neither a relation between ear canal dimensions and compliance of the wall, nor other relations to physiological properties are given.
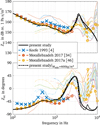 |
Figure 15 Input impedances of the ear Zec resulting from the models of the present study with aec = 1.9 mm, Lec = 8.5 mm (black), according to [4] (blue), according to [34] (red), and according to [46] (yellow), together with ear canal impedances measured in infants ears with normal middle ear from [41]. The infants’ age is between 16 and 28 days. |
In [45], a finite-element model of a 22 days old newborn’s ear canal was presented. The purpose of that model was to study the volume change in the ear canal under different static pressures of air as applied in tympanometry. The authors showed that using a Young’s modulus of the soft tissue in the range from 30 kPa to 90 kPa and a Poisson’s ratio of 0.475 resulted in plausible displacements and volume changes. The values used in the present model are in that range (90 kPa for Young’s modulus) or very close since an incompressible medium is assumed (i.e Poisson’s ratio of 0.5).
Another finite-element model of the same ear as in [45] was published in [34]. In that study, the sensitivity of the acoustic input admittance of the ear to changes in material properties was investigated up to frequencies of 2 kHz. Finally, a model with material properties adjusted to match some clinical data was proposed. A refined version of the model, in which the frequency range was extended up to 10 kHz, was proposed in [46]. Compared to the model of the present study, their first version model results in similar predictions, see Figure 15. Between about 500 Hz to 1.5 kHz the impedance magnitude of their model is about 3 dB greater. At about 800 Hz the phase responses start to deviate resulting in a difference of 46° at 2 kHz (−33° with the model in [34] versus 13° with the model of the present study). The majority of the measurements depicted in Figure 15 have a positive phase value at 2 kHz and hence agree better with the model proposed here.
The prediction of their refined model is closer to that of the present study, especially in the frequency range from 1 to 2 kHz, as can be seen in Figure 15. At higher frequencies some substantial differences can be observed, in particular, at the magnitude maximum at 3.6 kHz and the phase maximum at 3 kHz. At these frequencies Zec transitions from dominance by ZD to dominance by the ear canal geometry. Compared to the measurements, the prediction of the present study tends to the maximum values measured and the prediction according to [46] tends to the lower values measured, however both predictions are within the range of measurements at frequencies between 2.4 kHz and 4 kHz. In the model according to [46], a resonance at about 6 kHz and a local minimum at 7 kHz can be seen which are not predicted with the model of the present study. In [46] it was explained that the resonance is caused by the first mode of the middle ear cavity and the minimum is caused by the first standing wave mode in the ear canal. A resonance in the middle ear cavities at about 6 kHz, but much less pronounced, could be predicted by the model of the present study if a value of 600 kg/m4 for the acoustic mass of the aditus ad antrum Mada would be used. However, a comparison with the measurements doesn’t show an effect of much importance, therefore, omitting Mada, as proposed in Section 2.2.2, seems to be justified. The magnitude minimum at 7 kHz could be reproduced, but it would require an ear canal length of at least 16 mm which doesn’t match the ear canal dimensions given in [34]. In summary, up to about 6 kHz the predictions of both models are comparable. However, the parametric model proposed here is easier to adapt to deviating properties, caused e.g. by inter-individual differences, than the single-case finite-element model from [46].
8 Discussion
Based on an existing model for a adults, a parametric electro-acoustic model has been developed, allowing predictions of acoustic input impedances of young infants’ ears. Special attention has been paid to using model parameters representing physiological conditions whenever possible, and to reducing the number of parameters in comparison to the original model for adults according to [18–20]. Predictions from the model showed that for frequencies below about 1 kHz, the ear canal impedance Zec is determined by the volume of air in the ear canal and by the compliant ear canal walls and that of the eardrum. At a medium frequency range around 1.8 kHz, Zec is determined by the eardrum impedance ZD, and at high frequencies (above about 3 kHz) Zec is determined by the ear canal geometry. A comparison with impedances measured on infant’s ears showed a good agreement in the main characteristics.
8.1 Current limitations of the model
The proposed model is developed to predict acoustic input impedances of the ears of young infants aged younger than 6 months. Known age-dependent physiological differences have been considered in the model, these differences are: (1) the soft and flexible ear canal walls which will get acoustically rigid with increasing age. (2) Pneumatisation of the mastoid, which increases with age and can be neglected for very young infants. (3) The volume of the tympanic cavity and the antrum, which also increases with age. (4) The thickness of the pars flaccida of the tympanic membrane, which decreases with age. It would be desirable to have the possibility of a continuous age-dependent adaptation of the model. However, this would require a more detailed knowledge about the developmental processes, which is not available at present.
In the proposed model, the ear canal shape is restricted to consecutive cylindrical segments with different cross sections. Real ear canal shapes will deviate from circular cross sections and will have curvatures. It is assumed that these differences may have a noticeable effect on the acoustic input impedance of the ear Zec at high frequencies (≥4 kHz), but only very small effects at medium frequencies. However, at high frequencies, many of the measured Zec showed magnitudes larger than those predicted by the model. A higher magnitude of Zec in that frequency range means that the impact of ZD on Zec is larger. The consequence for model predictions of the impact of specific middle ear conditions on immitance measurements is that the influence of specific middle ear conditions may not only be detectable at medium frequencies, but at higher frequencies as well.
The proposed model is currently limited to predictions at ambient pressure in the ear canal, whereas many WAI test are performed over a tympanometric range of air pressures in the ear canal. Nevertheless, the model is potentially extendable to account for differences in air pressure between ear canal and middle ear, by linearizing it to different static pressure states, as will be discussed in the companion paper [47].
Although the structure of the model would permit predictions of middle ear transfer functions, such predictions weren’t investigated. The aim of the proposed model is to support WAI-measurements by permitting statements about the acoustic input impedances Zec and ZD. A verification of the model for the prediction of middle ear transfer impedances would require considerably different reference data. This may be part of future work.
8.2 Differences to similar models
The proposed model confirms that there are large differences in the acoustic input impedances of ear canal and eardrum between adults and young infants. Very few models for young infant ears exist. The electro-acoustic modeling approach in [4] was intended to simulate the effects of the soft and flexible ear canal walls of young infants. The predicted effects are somewhat comparable to those predicted by the model of the present study. However, the parts of the model in [4] representing the ear canal geometry and the eardrum are very basic and not related to physiological properties. In contrast, the model parameters of the present study are very close to physiological properties allowing predictions for different physiological conditions. On the other hand, finite-element models of young infant ears exist [34, 36, 46]. The predictions of these models are very similar to those of the present model. The model proposed in [46] allows predictions up to 10 kHz. Compared to the model of the present study, properties of ear canal shape can be reproduced much better with the finite-element model. However, predictions of the effects resulting from individual differences or different middle ear conditions would be extremely costly.
9 Conclusions based on the model
Based on the parametric model of young infants’ eardrum and ear canal impedances proposed in this paper, the following conclusions can be made:
The soft and flexible ear canal walls in young infant ears affect the measured acoustic input impedance of the ear Zec up to about 1.5 kHz, no significant effect is expected at higher frequencies.
At a medium frequency range around 1.8 kHz, the measured input impedance Zec is dominated by the eardrum impedance ZD. Therefore, it can be expected that different middle ear conditions will have the largest effect on Zec in the medium frequency range.
At high frequencies, the model predictions indicate that Zec is dominated by ear canal properties and therefore, it might not be possible to detect different middle ear conditions at high frequencies. However, predictions must be taken with caution at these frequencies because many measurements showed higher Zec magnitudes which could mean that in some cases middle ear conditions could still be detected.
In part II of this paper, the model will be extended to predict the influence of different pathological middle ear conditions on the acoustic input impedances of the ear canal and the eardrum of young infants in order to investigate implications for WAI-measurements.
Conflict of interest
The authors declare no conflict of interest.
Acknowledgments
We would like to thank the two anonymous reviewers for their thoughtful comments on an earlier version of the manuscript. This work was partly funded by the Jade University’s research program Jade2Pro and partially supported by Deutsche Forschungsgemeinschaft (DFG, German Research Foundation) – Project-ID 352015383 – SFB 1330/2 C1.
References
- C.D. Marchant, P.A. Shurin, V.A. Turczyk, D.E. Wasikowski, M.A. Tutihasi, S.E. Kinney: Course and outcome of otitis media in early infancy: A prospective study. The Journal of Pediatrics 104, 6 (1984) 826–831. https://doi.org/10.1016/s0022-3476(84)80475-8. [CrossRef] [PubMed] [Google Scholar]
- J.L. Paradise, H.E. Rockette, D.K. Colborn, B.S. Bernard, C.G. Smith, M. Kurs-Lasky, J.E. Janosky: Otitis media in 2253 pittsburgh-area infants: Prevalence and risk factors during the first two years of life. Pediatrics 99, 3 (1997) 318–333. https://doi.org/10.1542/peds.99.3.318. [CrossRef] [PubMed] [Google Scholar]
- M.P. Feeney, L.L. Hunter, J. Kei, D.J. Lilly, R.H. Margolis, H.H. Nakajima, S.T. Neely, B.A. Prieve, J.J. Rosowski, C.A. Sanford, K.S. Schairer, N. Shahnaz, S. Stenfelt, S.E. Voss: Consensus statement. Ear and Hearing 34, Supplement 1 (2013) 78s–79s. https://doi.org/10.1097/aud.0b013e31829c726b. [CrossRef] [PubMed] [Google Scholar]
- D.H. Keefe, J.C. Bulen, K.H. Arehart, E.M. Burns: Ear-canal impedance and reflection coefficient in human infants and adults. The Journal of the Acoustical Society of America 94, 5 (1993) 2617–2638. https://doi.org/10.1121/1.407347. [CrossRef] [PubMed] [Google Scholar]
- D.H. Keefe, R.C. Folsom, M.P. Gorga, B.R. Vohr, J.C. Bulen, S.J. Norton: Identification of neonatal hearing impairment: ear-canal measurements of acoustic admittance and reflectance in neonates. Ear and Hearing 21, 5 (2000) 443–461. [CrossRef] [PubMed] [Google Scholar]
- C.A. Sanford, M.P. Feeney: Effects of maturation on tympanometric wideband acoustic transfer functions in human infants. The Journal of the Acoustical Society of America 124, 4 (2008) 2106–2122. https://doi.org/10.1121/1.2967864. [CrossRef] [PubMed] [Google Scholar]
- C.A. Sanford, D.H. Keefe, Y.-W. Liu, D. Fitzpatrick, R.W. McCreery, D.E. Lewis, M.P. Gorga: Soundconduction effects on distortion-product otoacoustic emission screening outcomes in newborn infants: test performance of wideband acoustic transfer functions and 1-kHz tympanometry. Ear and hearing 30, 6 (2009) 635–652. https://doi.org/10.1097/AUD. 0b013e3181b61cdc. [CrossRef] [PubMed] [Google Scholar]
- L.A. Werner, E.C. Levi, D.H. Keefe: Ear-canal wideband acoustic transfer functions of adults and two-to nine-month-old infants. Ear and Hearing 31, 5 (2010) 587–598. https://doi.org/10.1097/aud.0b013e3181e0381d. [CrossRef] [PubMed] [Google Scholar]
- S. Aithal, J. Kei, C. Driscoll, A. Khan, A. Swanston: Wideband absorbance outcomes in newborns: A comparison with high-frequency tympanometry, automated brainstem response, and transient evoked and distortion product otoacoustic emissions. Ear and Hearing 36, 5 (2015) e237–e250. https://doi.org/10.1097/AUD.0000000000000175. [CrossRef] [PubMed] [Google Scholar]
- C.M. Blankenship, L.L. Hunter, D.H. Keefe, M.P. Feeney, D.K. Brown, A. McCune, D.F. Fitzpatrick, L. Lin: Optimizing clinical interpretation of distortion product otoacoustic emissions in infants. Ear & Hearing 39, 6 (2018) 1075–1090. https://doi.org/10.1097/aud.0000000000000562. [CrossRef] [PubMed] [Google Scholar]
- J. Pitaro, L. Al Masaoudi, H. Motallebzadeh, W.R.J. Funnell, S.J. Daniel: Wideband reflectance measurements in newborns: Relationship to otoscopic findings. International Journal of Pediatric Otorhinolaryngology 86 (2016) 156–160. https://doi.org/10.1016/j.ijporl.2016.04.036. [CrossRef] [PubMed] [Google Scholar]
- B.A. Prieve, K.R. Vander Werff, J.L. Preston, L. Georgantas: Identification of conductive hearing loss in young infants using tympanometry and wideband reflectance. Ear and Hearing 34, 2 (2013) 168–178. https://doi.org/10.1097/aud.0b013e31826fe611. [CrossRef] [PubMed] [Google Scholar]
- N. Shahnaz, A. Cai, L. Qi: Understanding the developmental course of the acoustic properties of the human outer and middle ear over the first 6 months of life by using a longitudinal analysis of power reflectance at ambient pressure. Journal of the American Academy of Audiology 25, 5 (2014) 495–511. https://doi.org/10.3766/jaaa.25.5.8. [CrossRef] [PubMed] [Google Scholar]
- J. Zwislocki: Analysis of the middle-ear function. Part I: Input impedance. The Journal of the Acoustical Society of America 34, 8 (1962) 1514–1523. https://doi.org/10.1121/1.1918382. [CrossRef] [Google Scholar]
- E.A.G. Shaw, R. Teranishi: Sound pressure generated in an external-ear replica and real human ears by a nearby point source. The Journal of the Acoustical Society of America 44, 1 (1968) 240–249. https://doi.org/10.1121/1.1911059. [CrossRef] [PubMed] [Google Scholar]
- M. Kringlebotn: Network model for the human middle ear. Scandinavian Audiology 17, 2 (1988) 75–85. https://doi.org/10.3109/01050398809070695. [CrossRef] [PubMed] [Google Scholar]
- C.A. Shera, G. Zweig: Middle-ear phenomenology: The view from the three windows. The Journal of the Acoustical Society of America 92, 3 (1992) 1356–1370. https://doi.org/10.1121/1.403929. [CrossRef] [PubMed] [Google Scholar]
- H. Hudde, A. Engel: Measuring and modeling basic properties of the human middle ear and ear canal. Part I: Model structure and measuring techniques. ACUSTICA/acta acustica 84, 4 (1998) 720–738. [Google Scholar]
- H. Hudde, A. Engel: Measuring and modeling basic properties of the human middle ear and ear canal. Part II: Ear canal, middle ear cavities, eardrum, and ossicles. ACUSTICA/acta acustica 84, 5 (1998) 894–913. [Google Scholar]
- H. Hudde, A. Engel: Measuring and modeling basic properties of the human middle ear and ear canal. Part III: Eardrum impedances, transfer functions and model calculations. ACUSTICA/acta acustica 84, 6 (1998) 1091–1108. [Google Scholar]
- D.H. Keefe: Human middle-ear model with compound eardrum and airway branching in mastoid air cells. The Journal of the Acoustical Society of America 137, 5 (2015) 2698–2725. https://doi.org/10.1121/1.4916592. [CrossRef] [PubMed] [Google Scholar]
- M. Blau, T. Sankowsky, P. Roeske, H. Mojallal, M. Teschner, C. Thiele: Prediction of the sound pressure at the ear drum in occluded human cadaver ears. Acta Acustica united with Acustica 96, 3 (2010) 554–566. [CrossRef] [Google Scholar]
- T. Sankowsky-Rothe, M. Blau, S. Köhler, A. Stirnemann: Individual equalization of hearing aids with integrated ear canal microphones. Acta Acustica united with Acustica 101, 3 (2015) 552–566. https://doi.org/10.3813/AAA.918852. [CrossRef] [Google Scholar]
- T. Sankowsky-Rothe, M. Blau, E. Rasumow, H. Mojallal, M. Teschner, C. Thiele: Prediction of the sound pressure at the ear drum in occluded human ears. Acta Acustica united with Acustica 97, 4 (2011) 656–668. https://doi.org/10.3813/AAA.918445. [CrossRef] [Google Scholar]
- M. Blau, M. Bornitz, T. Zahnert, G. Hofmann, K.B. Hüttenbrink: Entwicklung eines implantierbaren Mikrofons zum Einsatz in Cochlea-Implantaten und implantierbaren Hörgeräten, BMBF-Forschungsbericht. Bundesministerium für Bildung und Forschung, Research rep. TIB Hannover (2003) 1–49. https://www.tib.eu/de/suchen/id/tema%3ATEMA20040703524. [Google Scholar]
- J.J. Rosowski, P.J. Davis, S.N. Merchant, K.M. Donahue, M.D. Coltrera: Cadaver middle ears as models for living ears: Comparisons of middle ear input immittance. Annals of Otology, Rhinology and Laryngology 99, 5 Pt 1 (1990) 403–412. [CrossRef] [PubMed] [Google Scholar]
- T. Sankowsky-Rothe: Parametric model of young infants’ eardrum and ear canal acoustic input impedances (version v1.0) [Code]. (2022). URL: https://github.com/tobiassankowsky/acoustic_impedance_infant_ear. [Google Scholar]
- A.H. Benade: On the propagation of sound waves in a cylindrical conduit. The Journal of The Acoustical Society of America 44, 2 (1968) 616–623. https://doi.org/10.1121/1.1911130. [CrossRef] [Google Scholar]
- C. Abdala, D.H. Keefe: Morphological and functional ear development, in Human Auditory Development, Springer, New York, 2011, pp. 19–59. https://doi.org/10.1007/978-1-4614-1421-6_2. [Google Scholar]
- J. Fels, J. Paprotny: Ear canal properties of children: Dimensions of ear canals and simulation of the input impedance. Acta Acustica united with Acustica 99, 4 (2013) 582–589. https://doi.org/10.3813/AAA.918637. [CrossRef] [Google Scholar]
- D.H. Keefe, J.C. Bulen, S.L. Campbell, E.M. Burns: Pressure transfer function and absorption cross section from the diffuse field to the human infant ear canal. The Journal of the Acoustical Society of America 95, 1 (1994) 355–371. https://doi.org/10.1121/1.408380. [CrossRef] [PubMed] [Google Scholar]
- M. McLellan, C. Webb: Ear studies in the newborn infant. The Journal of Pediatrics 51, 6 (1957) 672–677. https://doi.org/10.1016/s0022-3476(57)80102-4. [CrossRef] [PubMed] [Google Scholar]
- L. Holte, R.M. Cavanaugh, R.H. Margolis: Ear canal wall mobility and tympanometric shape in young infants. The Journal of pediatrics 117, 1 Pt 1 (1990) 77–80. [CrossRef] [PubMed] [Google Scholar]
- H. Motallebzadeh, N. Maftoon, J. Pitaro, W.R.J. Funnell, S.J. Daniel: Finite-element modelling of the acoustic input admittance of the newborn ear canal and middle ear. Journal of the Association for Research in Otolaryngology : JARO 18 (2017) 25–48. https://doi.org/10.1007/s10162-016-0587-3. [CrossRef] [PubMed] [Google Scholar]
- A. Ikui, I. Sando, S.-I. Haginomori, M. Sudo: Postnatal development of the tympanic cavity: A computer aided reconstruction and measurement study. Acta Oto-Laryngologica 120, 3 (2000) 375–379. https://doi.org/10.1080/000164800750000595. [CrossRef] [PubMed] [Google Scholar]
- L. Qi, W.R.J. Funnell, S.J. Daniel: A nonlinear finiteelement model of the newborn middle ear. The Journal of the Acoustical Society of America 124, 1 (2008) 337–347. https://doi.org/10.1121/1.2920956. [CrossRef] [PubMed] [Google Scholar]
- S. Mansour, J. Magnan, H. Haidar, K. Nicolas, S. Louryan: Comprehensive and clinical anatomy of the middle ear, 1st ed., Springer-Verlag, Berlin Heidelberg. 2013. https://doi.org/10.1007/978-3-642-36967-4. [CrossRef] [Google Scholar]
- A. Lenk: Elektromechanische Systeme Band 2. Systeme mit verteilten Parametern, VEB Verlag Technik, Berlin, 1977. [Google Scholar]
- C.B. Ruah, P.A. Schachern, D. Zelterman, M.M. Paparella, T.H. Yoon: Age-related morphologic changes in the human tympanic membrane. A light and electron microscopic study. Archives of Otolaryngology– Head & Neck Surgery 117, 6 (1991) 627–634. https://doi.org/10.1121/1.2920956. [CrossRef] [PubMed] [Google Scholar]
- J. Olszewski: The morphometry of the ear ossicles in humans during development. Anatomischer Anzeiger 171, 3 (1990) 187–191. [PubMed] [Google Scholar]
- T. Sankowsky-Rothe, A. Becker, K. Plotz, R. Schönfeld, A. Radeloff, S. Van de Par, M. Blau: Acoustic input impedance of infants with normal and pathological middle ear, in Proceedings of the ICA 2019 and EAA Euroregio. 23rd International Congress on Acoustics, integrating 4th EAA Euroregio 2019 (Sept. 2019), Aachen, Germany, 2019. ISBN: 978-3-93929615-7. [Google Scholar]
- A. Stirnemann: Ein Mittelohrmodell basierend auf der Außenohr Transferimpedanz, in Fortschritte der Akustik DAGA 2011, DEGA, 2011. [Google Scholar]
- IEC-60318-4: Electroacoustics – simulators of human head and ear – part 4: Occluded-ear simulator for the measurement of earphones coupled to the ear by ear inserts, International Electrotechnical Organisation Standard, 2007. [Google Scholar]
- A. Stirnemann, H. Graf, H. Meier: Akustische Impedanzmessungen in der Hörgerätetechnik, in Fortschritte der Akustik DAGA 2003, DEGA, Berlin, 2003, pp. 496–497. [Google Scholar]
- L. Qi, H. Liu, J. Lutfy, W.R.J. Funnell, S.J. Daniel: A nonlinear finite-element model of the newborn ear canal. The Journal of the Acoustical Society of America 120, 6 (2006) 3789–3798. https://doi.org/10.1121/1.2363944. [CrossRef] [PubMed] [Google Scholar]
- H. Motallebzadeh, N. Maftoon, J. Pitaro, W.R.J. Funnell, S.J. Daniel: Fluid-structure finite-element modelling and clinical measurement of the wideband acoustic input admittance of the newborn ear canal and middle ear. Journal of the Association for Research in Otolaryngology 18, 5 (2017) 671–686. https://doi.org/10.1007/s10162-017-0630-z. [CrossRef] [PubMed] [Google Scholar]
- T. Sankowsky-Rothe, S. van de Par, M. Blau: Parametric model of young infants’ eardrum and ear canal impedances supporting immittance measurement results. Part II: Prediction of eardrum and ear canal impedances for common middle ear pathologies. Acta Acustica (submitted to 2022). [Google Scholar]
Data availability statement
An implementation of the complete model is available on GitHub, under the reference https://github.com/tobiassankowsky/acoustic_impedance_infant_ear.
Appendix A
A.1 Notes on damping models for compliant ear canal walls
In order to account for the damping caused by the soft and flexible ear canal walls, in the present study, each slice i of the ear ear canal has a complex impedance Zw,i in parallel (see Section 2.2.1). Zw,i is a series resonator with an acoustic mass, an acoustic compliance and an acoustic resistance. The acoustic resistance is modeled using a frequency independent damping ratio ζst (equation (7) with damping constants α and β. The modeling is similar as in [34, 46], however, a significant difference is that in the present study the damping constants are chosen such that α/ω = βω with the result that the undamped natural frequency equals the damped resonant frequency of Zw,i, i.e. the minimum of the impedance magnitude coincide with a phase value of 0° (see left side of Fig. 16 black line). In [34, 46], by contrast, the phase value of Zw at the magnitude minimum is negative, i.e. α/ω > βω or rather the resistive damping is dominated to a greater extent by mass than by compliance (see left side of Fig. 16 red line). Another modeling approach is used in [4] in which Zw is modeled by a resonator consisting of an acoustic mass in series with a resistance and a compliance in parallel. The resulting effect is that the resistive damping is dominated only by the compliance (see left side of Fig. 16 red circles).
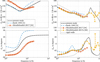 |
Figure 16 Ear canal wall impedance Zw (left) and input impedances of the ear Zec (right) resulting from the models of the present study with aec = 1.9 mm, Lec = 8.5 mm (black), according to [4] (blue), according to [34] (red), and according to [46] (yellow). Additionally, Zec resulting from the models of the present study assuming rigid ear canal walls is depicted (gray). |
The input impedance of the ear Zec of the different models is depicted on the right side of Figure 16. For comparisons, Zec resulting from the model of the present study assuming rigid ear canal walls is depicted, additionally. A noticeable difference caused by the different approaches used to model Zw results only in the phase of Zec at very low frequencies (<400 Hz) with the model according to [4] compared to the other models. Note that the difference at about 500 Hz is mainly caused by the input impedance of the eardrum ZD which is assumed to be larger in [4] compared to the other models.
It can be concluded that the effect of the different approaches which have been proposed to model the resistive component of the damping caused by the soft and flexible ear canal walls do not show a substantial different impact on Zec. If at all, differences are limited to the impedance phase at frequencies below about 400 Hz.
A.2 Default parameter values
Default values of ear canal parameters.
Default values of middle ear cavities parameters.
Default values of middle ear kernel parameters.
Default values of stapes and cochlea parameters.
Cite this article as: Sankowsky-Rothe T. van de Par S. & Blau M. 2022. Parametric model of young infants’ eardrum and ear canal impedances supporting immittance measurement results. Part I: Development of the model. Acta Acustica, 6, 53.
All Tables
All Figures
|
Figure 1 General model structure for sound transmission from the ear canal into the cochlea according to [18]. |
| In the text | |
|
Figure 2 Sketch of the ear canal slice model showing the ear canal entrance E, the definition of the drum area D and the termination point T. |
| In the text | |
|
Figure 3 Reproduction of the modeling results in [34] of the ear canal wall admittance and admittance of the air in the canal using equation (4). The circles correspond to [34, Fig. 6] and the lines correspond to equation (4) using values of ρst = {1000 kg/m3, 1100 kg/m3 and 1200 kg/m3}, dst = 3 mm, Ast = 119 mm2, Est = {20 kPa, 210 kPa and 400 kPa}, ζst = {0.1, 0.25 and 0.4}, and |
| In the text | |
|
Figure 4 Equivalent circuit of the middle ear cavities model. The value of the impedance Zcav results from the pressure pcav divided by the volume velocity at the eardrum qD. |
| In the text | |
|
Figure 5 Equivalent circuit of the adapted middle ear cavities model. The value of the acoustic impedance Zcav results from the pressure pcav divided by the volume velocity at the eardrum qD. |
| In the text | |
|
Figure 6 Equivalent circuit of the middle ear kernel two-port comprising the components of eardrum, malleus and incus according to [19]. |
| In the text | |
|
Figure 7 Equivalent circuit of the common mechanical admittance ydmi comprising parts of the eardrum, the malleus and the incus. |
| In the text | |
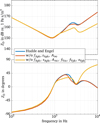 |
Figure 8 Impact of model simplifications in the kernel on ZD for the model according to [20]. |
| In the text | |
|
Figure 9 Eardrum impedances of the model according to [20], the model adapted to infants, and additionally the infant model extended by the model components of the aditus ad antrum (ADA). |
| In the text | |
|
Figure 10 Eardrum impedances ZD (left) and input impedances of the ear Zec (right) resulting from the model according to [20] and our model adapted to infant's ears. |
| In the text | |
|
Figure 11 Ear canal impedances Zec resulting from our model adapted to infant's ears for different ear canal radii (left) and different ear canal lengths (right). |
| In the text | |
|
Figure 12 Ear canal impedances Zec resulting from the model adapted to infant's ears for different values of the parameters modeling the compliant ear canal walls. |
| In the text | |
|
Figure 13 Ear canal impedance resulting from the model using two different sets of ear canal radius and diameter (black lines) together with ear canal impedances measured in N = 30 infant ears from [41] (pale colored lines). |
| In the text | |
|
Figure 14 Input impedances of the ear Zec resulting from the model adapted to infant's ears for different ear canal shapes while preserving ear canal volume and length, together with ear canal impedances measured in infants ears with normal middle ear from [41]. |
| In the text | |
|
Figure 15 Input impedances of the ear Zec resulting from the models of the present study with aec = 1.9 mm, Lec = 8.5 mm (black), according to [4] (blue), according to [34] (red), and according to [46] (yellow), together with ear canal impedances measured in infants ears with normal middle ear from [41]. The infants’ age is between 16 and 28 days. |
| In the text | |
|
Figure 16 Ear canal wall impedance Zw (left) and input impedances of the ear Zec (right) resulting from the models of the present study with aec = 1.9 mm, Lec = 8.5 mm (black), according to [4] (blue), according to [34] (red), and according to [46] (yellow). Additionally, Zec resulting from the models of the present study assuming rigid ear canal walls is depicted (gray). |
| In the text | |
Current usage metrics show cumulative count of Article Views (full-text article views including HTML views, PDF and ePub downloads, according to the available data) and Abstracts Views on Vision4Press platform.
Data correspond to usage on the plateform after 2015. The current usage metrics is available 48-96 hours after online publication and is updated daily on week days.
Initial download of the metrics may take a while.