Open Access
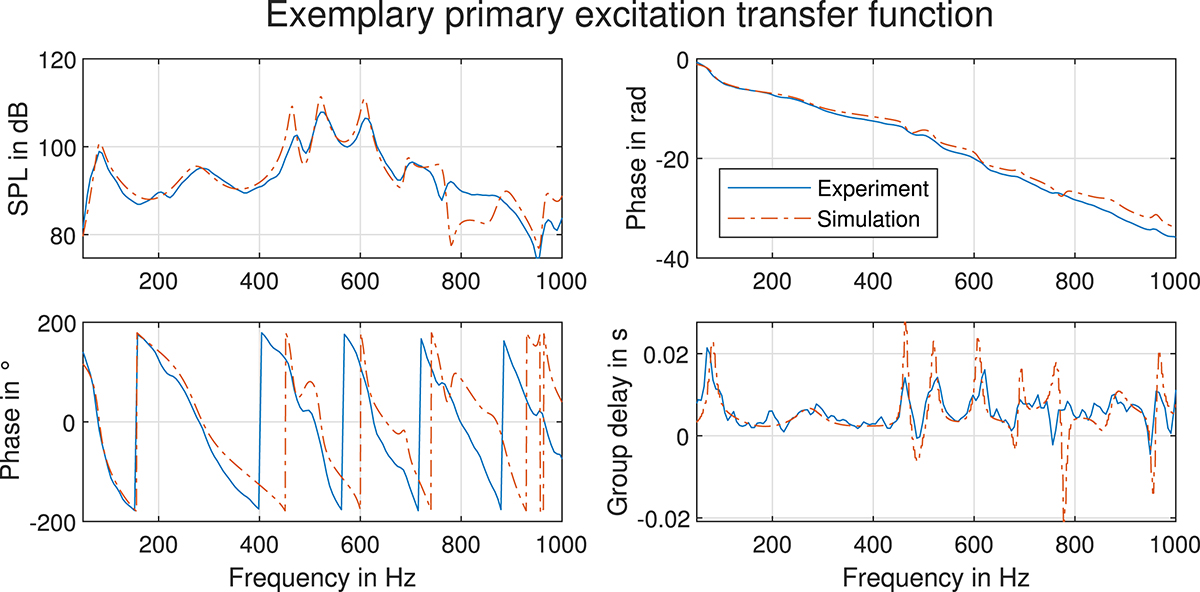
Figure 9.
Download original image
Comparison of an exemplary transfer function by magnitude and phase response between experiment and simulation for the primary excitation to an error sensor. On the left: magnitude in dB (top) and phase in degree (bottom). On the right: unwrapped phase in radians (top) and group delay (bottom).
Current usage metrics show cumulative count of Article Views (full-text article views including HTML views, PDF and ePub downloads, according to the available data) and Abstracts Views on Vision4Press platform.
Data correspond to usage on the plateform after 2015. The current usage metrics is available 48-96 hours after online publication and is updated daily on week days.
Initial download of the metrics may take a while.